
Image
|
Figure Caption
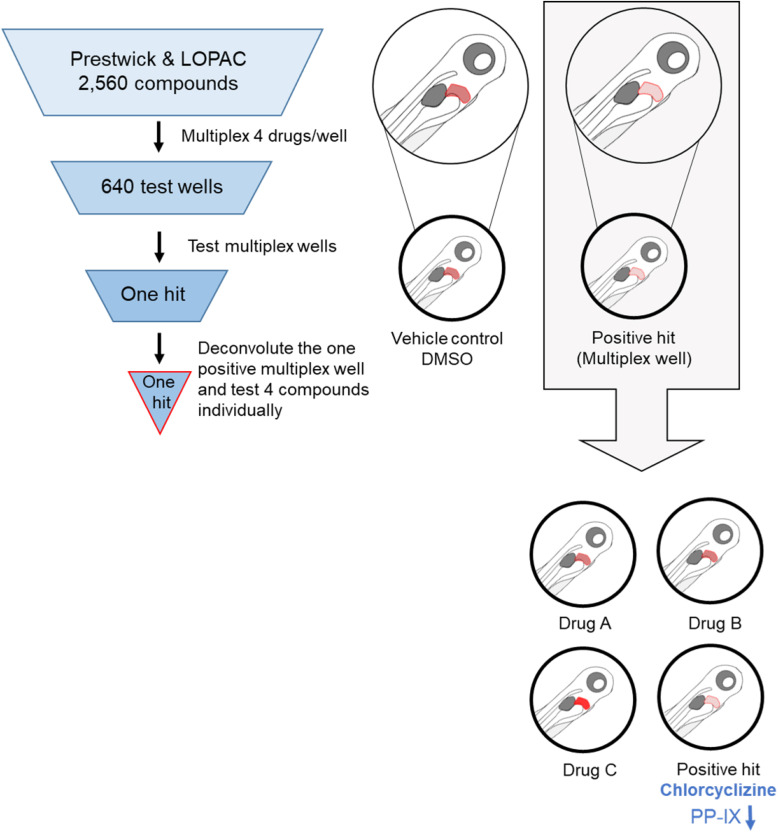
Fig. 1 Schematic of the high-throughput drug screening in experimental EPP zebrafish. A total of 2560 compounds were multiplexed into 640 test wells. Positive hits were identified on the basis of significant reduction of the PP-IX (red) signal in EPP zebrafish livers (n ≥10 fish larvae; N ≥4 experiments). Funnel cartoons represent the progressive flow in the number of active compounds toward a validated optimal hit/compound for further investigation. Note the decrease in red liver fluorescence (right upper part of the schematic).
Acknowledgments
This image is the copyrighted work of the attributed author or publisher, and
ZFIN has permission only to display this image to its users.
Additional permissions should be obtained from the applicable author or publisher of the image.
Full text @ Cell Mol Gastroenterol Hepatol