
Fig. 7
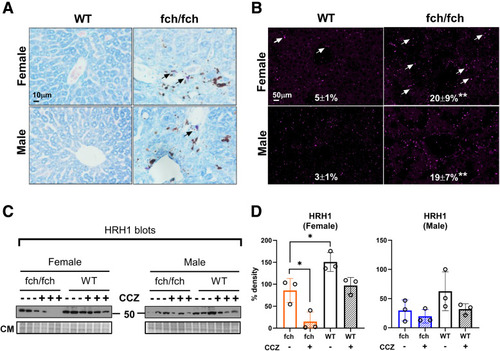
MC presence and HRH1 expression in wild-type and fch/fch livers. (A) May-Grunwald Giemsa staining of wild-type and fch/fch livers. Mast cell staining is highlighted by black arrows. (B) Immunofluorescence staining of MCP1 in wild-type (WT) and fch/fch livers (MCP1 puncta are indicated by white arrows) with quantified relative staining shown. The MCP1 staining images of the fch/fch (PBS) group in figures 7B (right panels) and 8A (first and third panels from left) were taken from a representative mouse liver section. Quantification is based on a group of immunofluorescence stainings (n = 3 livers, 2 image fields per liver). Another group (n = 2 livers, 2 images fields per liver) manifested a similar trend. (C) Immunoblots of the histamine receptor H1 (HRH1) in total liver lysates obtained from fch/fch and WT female and male mice with or without treatment with CCZ. (D) Densitometry analysis of HRH1 expression shown in panel C. HRH1 expression is suppressed in female fch/fch mice when compared with their WT controls, and CCZ further decreases HRH1 expression preferentially in female livers. Data are shown as mean ± SD (n = 3 livers/group). Statistical analysis was performed using the 1-way ANOVA test, ∗P < .05. |