
Fig. 8
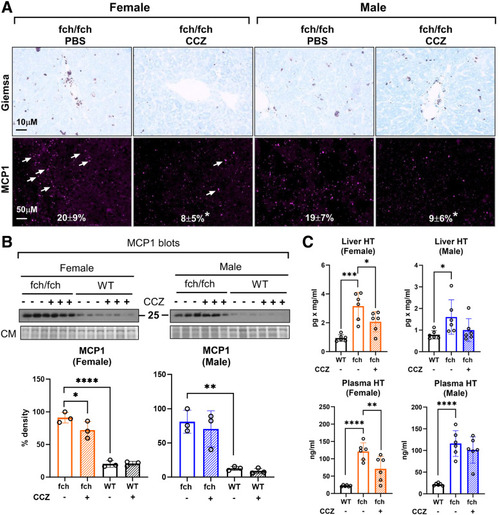
CCZ reduces MC presence and histamine levels in the female liver and plasma. (A) May-Grunwald Giemsa staining and immunofluorescence staining of mast cell protease 1 (MCP1) on fch/fch and wild-type livers. MCP1 puncta are indicated by white arrows. Expressions of MCP1 puncta are shown as mean percent cell area ± SD (n = 3 livers, 2 image fields/liver). (B) Immunoblot and densitometry analysis of MCP1 in fch/fch and wild-type livers (n = 3 livers/group). CM, Coomassie staining. (C) Histamine levels in the liver and plasma. Data are shown as mean ± SD (n = 6 mice/group). Statistical analysis was performed by 1-way ANOVA test, ∗∗∗∗P < .0001; ∗∗∗P < .001; ∗∗P < .01; ∗P < .05. |