
Fig. 2
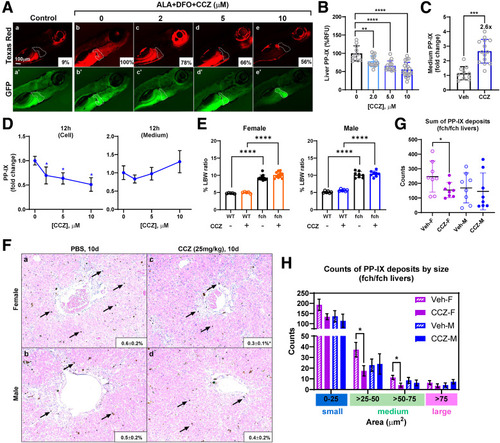
CCZ reduces PP-IX accumulation in experimental zebrafish, PMH, and fch/fch mouse EPP models. (A) Representative fluorescence images of EPP zebrafish larvae treated with the vehicle DMSO and CCZ at indicated concentrations. (B) Quantification of zebrafish liver PP-IX fluorescence as mean ± SD (9 ± 4%, 100 ± 20%, 78 ± 15%, 66 ± 14%, 56 ± 20%). (C) PP-IX levels in the zebrafish culture medium normalized to the level in the DMSO-treated controls (n ≥10 larvae per condition, N = 4 experiments). (D) Freshly isolated hepatocytes from FVB/N mice were treated with vehicle or ALA + DFO for 12 hours. Relative PP-IX fluorescence in the hepatocytes and culture medium is shown normalized to the level in the untreated ALA + DFO group. Data are shown as mean ± SD (N = 4 experiments). (E) fch/fch mice manifest increased % liver-to-body weight (LBW) ratio that is nearly double the ratio of wild-type (WT) mice (female fch: 9.3 ± 0.8%; female WT: 4.8 ± 0.1%; male fch: 10 ± 0.9%; male WT: 5.1 ± 0.3%). CCZ does not alter the LBW ratio. Data are shown as mean ± SD (n = 5–8 mice per group, N = 2 experiments). Statistical analysis was performed using the 1-way ANOVA test, ∗∗∗∗P < .0001. (F) fch/fch male and female mice were treated with PBS or CCZ. Representative H&E liver sections and quantification of PP-IX area in the male and female fch/fch mice is shown. Arrows indicate medium-sized PP-IX deposits (n = 8 mice per group, N = 2 experiments). (G) Quantification of total PP-IX counts in male (M) and female (F) fch/fch livers treated with vehicle (Veh/PBS) or CCZ. (H) Quantification of small-, medium-, and large-sized PP-IX deposits. Data are shown as mean ± SD (n = 8 mice/group, N = 2 experiments). For panels (B–D) and (F–H) statistical analysis was performed by 2-tailed Student t-test. ∗∗∗∗P < .0001; ∗∗∗P < .001; ∗∗P < .01; ∗P < .05. |