
|
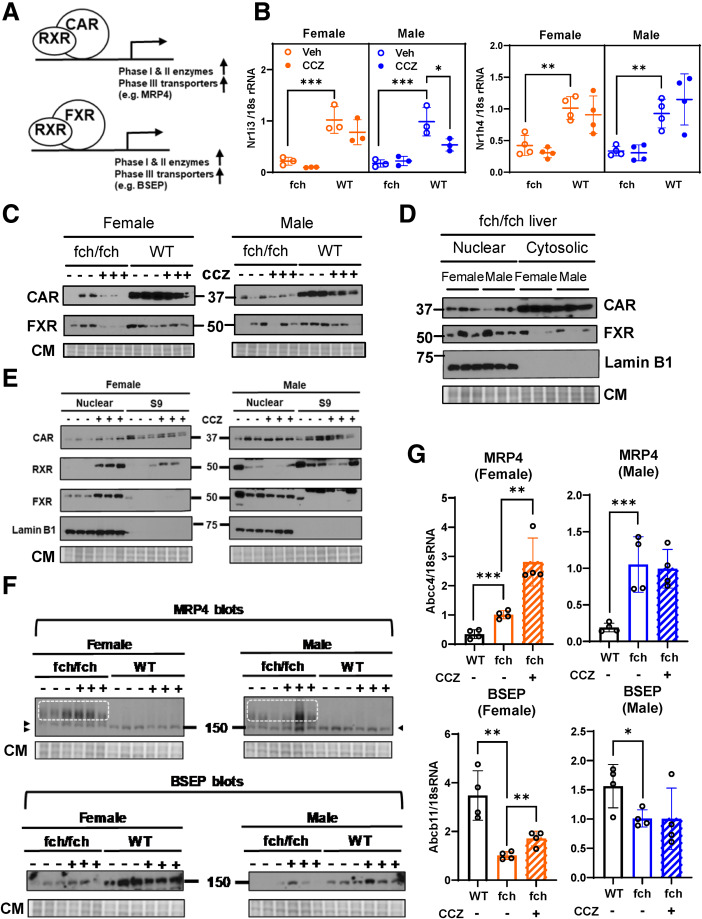
Fig. 10 Expression and subcellular partitioning of CAR and FXR. (A) Schematic diagram of the CAR/RXR and FXR/RXR gene transactivation system. (B) Relative mRNA expressions of Nr1i3/CAR and Nr1h4/FXR in female and male fch/fch vs wild-type (WT) livers (±CCZ). In WT male livers, CCZ treatment decreased CAR gene expression. (C) CAR and FXR protein expression is suppressed in fch/fch liver. CCZ administration decreases CAR and FXR protein expression further in livers of female fch/fch mice. (D) Liver homogenates were separated into nuclear- and cytoplasmic-enriched fractions. Baseline CAR and FXR expression is comparable in female and male fch/fch livers. Lamin B1 is used as a nuclear marker. Coomassie staining (CM) is included to show equal protein loading. (E) CCZ enriches nuclear localization of CAR, RXR, and FXR in female fch/fch livers. (F) Relative protein expression of MRP4 and BSEP. The MRP4 monomer is indicated by arrowhead. High molecular weight aggregates of MRP4 are highlighted by white dotted boxes. (G) Relative mRNA expression of MRP4 (upper row) and BSEP (lower row) in livers of female and male fch/fch (±CCZ) and WT mice. Statistical analysis was performed using the 1-way ANOVA test. ∗∗∗P < .001; ∗∗P < .01; ∗P < .05.