
- Title
-
Akt is a mediator of artery specification during zebrafish development
- Authors
- Zhou, W., Ghersi, J.J., Ristori, E., Semanchik, N., Prendergast, A., Zhang, R., Carneiro, P., Baldissera, G., Sessa, W.C., Nicoli, S.
- Source
- Full text @ Development
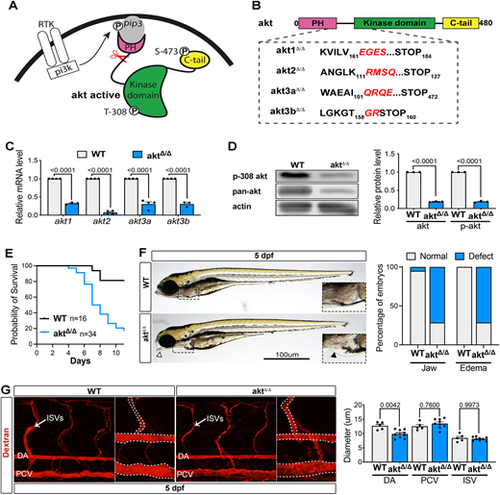
Zebrafish model of Akt loss of function, aktΔ/Δ. (A) Schematic showing Akt activation downstream of receptor tyrosine kinase activation. Scissors represent the site where CRISPR/Cas9 will create mutations. (B) CRISPR/Cas9 strategy. Akt protein structure representation shows protein sequence alignment of wild-type (Akt) and mutant (aktΔ/Δ) zebrafish lines. Mutated sequences are shown in red. (C) qRT-PCR showing mRNA levels in WT and aktΔ/Δ embryos at 4 dpf. Expression levels were normalized to the WT (n=3 independent pools of 5 embryos; two-way ANOVA with Šídák's multiple comparisons test). (D) Western blot analysis of WT and aktΔ/Δ embryos at 4 dpf (n=3 independent pools of 20 embryos; ordinary one-way ANOVA with Tukey's multiple comparison). (E) Survival curve of WT and aktΔ/Δ mutants. (F) Left: Brightfield images of zebrafish WT and aktΔ/Δ embryos at 5 dpf. Arrowhead shows jaw defect and the boxed area is shown at higher magnification in insets to show edema defects in more detail. Right: Graph shows the percentage of embryos with jaw or edema defects in WT and aktΔ/Δembryos [n=20 (WT), 9 (aktΔ/Δ) embryos]. (G) Left: Images of live 5 dpf WT or aktΔ/Δ embryos injected with tetramethylrhodamine/dextran (2,000,000 molecular weight). The dashed lines indicate the perimeter of the vessels. Graph represents the DA, PCV and ISV diameter quantification [n=5 (WT), 9 (aktΔ/Δ) embryos; Mann–Whitney test]. All quantifications are represented as mean±s.e.m. P, phosphorylation; PH, pleckstrin homology domain; pi3k, phosphatidylinositol 3-kinase; pip3, phosphatidylinositol (3,4,5)-trisphosphate; RTK, receptor tyrosine kinase. |
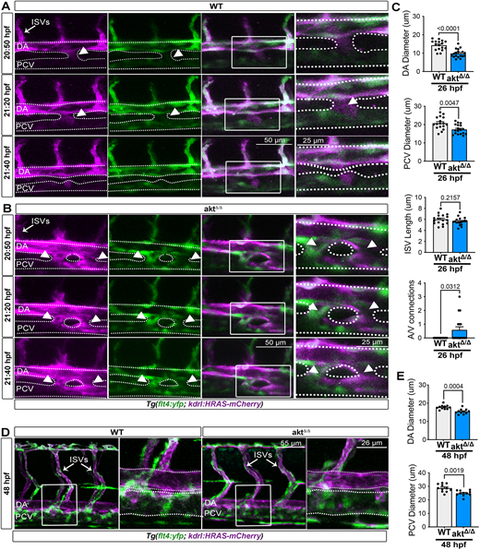
aktΔ/Δ embryos exhibit early vascular defects. (A,B) Images from live time-lapse movies of WT (A) and aktΔ/Δ mutants (B) in Tg (flt4:YFP; kdrl:HRAS-mCherry)hu4881;s896 embryos (20-22 hpf). Time stamps are on the left of each panel. White arrowheads indicate connection between the artery and vein. See also Movies 1 and 2. (C) Quantification of DA and PCV diameters and ISV length as well as quantification of artery and vein connections [n=17 (WT) and 18 (aktΔ/Δ) embryos; Mann–Whitney test and Wilcoxon test for A/V connection]. (D) Lateral view (25×) live images of WT and aktΔ/Δ embryos at 48 hpf (trunk region) in Tg (flt4:YFP; kdrl:HRAS-mCherry)hu4881;s896. (E) Quantification of DA and PCV diameters in WT and aktΔ/Δ mutants [n=17 (WT) and 18 (aktΔ/Δ) embryos; Mann–Whitney test]. All quantifications are represented as mean±s.e.m. In A.B,D, images on the right are magnified views of the boxed regions to the left, and dotted lines outline vessel perimeters. A/V, artery and vein; DA, dorsal aorta; ISVs, intersegmental vessels; PCV, posterior cardinal vein. |
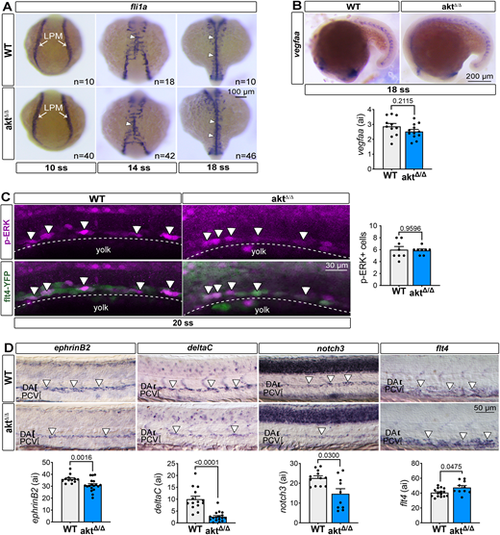
Loss of Akt impedes artery specification, but not angioblast homing or ERK signaling. (A) In situ hybridization of the marker fli1a labels the position of angioblasts at 10 ss, 14 ss and 18 ss in WT and aktΔ/Δ embryos. White arrows point to the lateral plate mesoderm (LPM) at 10 ss and white arrowheads indicate the midline formation at 14 ss and 18 ss. (B) Top: In situ hybridization of vegfaa at 18 ss in WT and aktΔ/Δ embryos. Bottom: Graph showing vefgaa quantification. All values are divided by 10,000. n=11 (WT) and 11 (aktΔ/Δ) embryos; Mann–Whitney test. (C) Left: Lateral view of immunofluorescence images showing phosphorylated ERK in the DA of WT and aktΔ/Δ embryos in Tg(flt4:YFP)hu4881 embryos at 20 ss [n=8 (WT) and 8 (aktΔ/Δ) embryos; Mann–Whitney test]. Dotted lines represent the DA primordium and arrowheads indicate p-ERK+ cells. Right: Graph showing the number of p-ERK+ cells. (D) Top: In situ hybridization of the arterial markers ephrinB2 [n=12 (WT) and 18 (aktΔ/Δ) embryos], deltaC [n=14 (WT) and 17 (aktΔ/Δ) embryos] and notch3 [n=12 (WT) and 10 (aktΔ/Δ) embryos] and the venous marker flt4 [n=15 (WT) and 10 (aktΔ/Δ) embryos] at 24 hpf. Arrowheads indicate the region expressing the gene of interest. Bottom: Graph representing all gene expression quantification. All values are divided by 10,000; Mann–Whitney test. All quantifications are represented as mean±s.e.m. ai, arbitrary unit; DA, dorsal aorta; LPM, lateral plate mesoderm; PCV, posterior cardinal vein. EXPRESSION / LABELING:
PHENOTYPE:
|
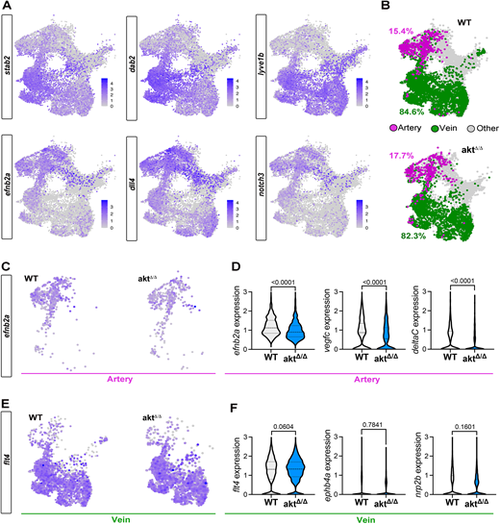
Single-cell RNA sequencing shows defects in artery specification of aktΔ/Δ endothelial cells. (A) UMAP of venous (stab2, dab2, lyve1b) and arterial (dll4, efnb2a, notch3) markers expressed in all endothelial cell subsets. (B) UMAP of artery and venous classification using our marker strategy identification. The percentages correspond to the proportion of arterial (magenta) or venous (green) cell populations out of all endothelial cell subsets. (C) UMAP of efnb2a expression in WT and aktΔ/Δ arterial subsets. (D) Violin plot of efnb2a, vegfc and deltaC expression within the arterial subset (Mann–Whitney test). (E) UMAP of flt4 expression in WT and aktΔ/Δ venous subsets. (F) Violin plot of flt4, ephb4a and nrp2b expression within the venous subset (Mann–Whitney test). All quantifications are represented as mean±s.e.m. |
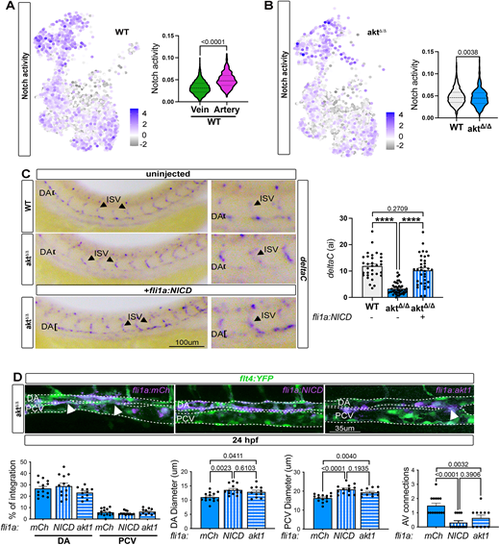
Loss of Akt alters artery specification via Notch signaling. (A) UMAP of Notch activity in WT and violin plot of Notch signaling activity in venous and arterial cells, obtained with AUCell (Mann–Whitney test). (B) UMAP of Notch activity in aktΔ/Δ venous and arterial cells, and violin plot of Notch activity in WT and aktΔ/Δ arterial cells (Mann–Whitney test). (C) In situ hybridization against deltaC in WT and aktΔ/Δ injected or not with endothelial cell-specific NICD (+fli1a:NICD) at 24 hpf [n=32 (WT), 43 (aktΔ/Δ) and 35 (aktΔ/Δ +fli1a:NICD) embryos; ordinary one-way ANOVA]. (D) Top: Live imaging of aktΔ/Δ embryos at 24 hpf injected or not with fli1a:mCherry, fli1a:akt1 or fli1a:NICDi. Arrowheads indicate connection between artery and vein. Dashed lines delineate the DA and PCV. Bottom: Quantification of the percentage of integration of each construct in the DA or PCV, DA and PCV diameters, and A/V connections [n=14 (aktΔ/Δ +fli1a:mCh), 13 (aktΔ/Δ +fli1a:NICD) and 11 (aktΔ/Δ +fli1a:akt1) embryos; ordinary one-way ANOVA]. All quantifications are represented as mean±s.e.m. DA, dorsal aorta; PCV, posterior cardinal vein. |
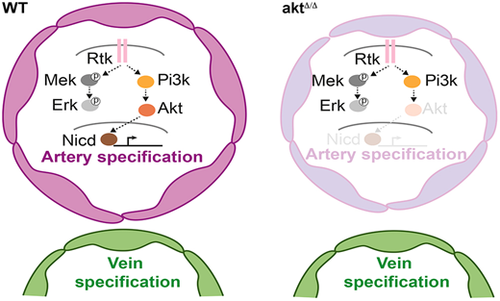
Model of artery specification controlled by Rtk/Akt/Notch signaling. In this study, we created the first zebrafish model with loss-of-function mutations in all four Akt genes (aktΔ/Δ). We found that Akt signaling is required for specifying endothelial cell progenitors into arteries independently of other kinases. Notably, restoring Notch activity in the dorsal aorta compensates for Akt loss, suggesting that Akt acts upstream of Notch in artery specification during embryonic development. Pi3k, phosphatidylinositol 3-kinase; Rtk, receptor tyrosine kinase. |