
Fig. 5
- ID
- ZDB-IMAGE-240903-179
- Genes
- Publication
- Zhou et al., 2024 - Akt is a mediator of artery specification during zebrafish development
- All Figures
- Figures for Zhou et al., 2024
|
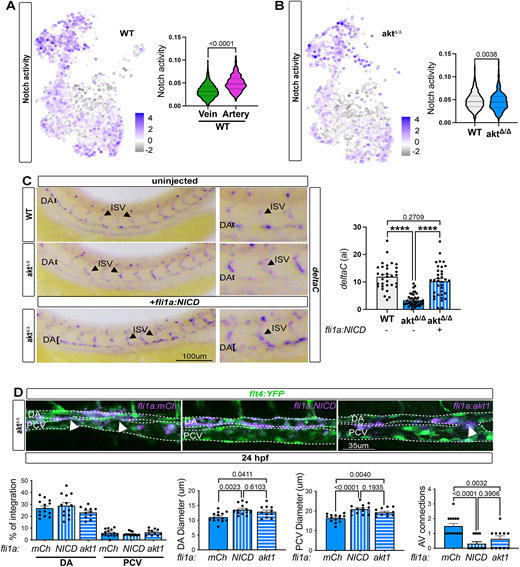
Fig. 5 Loss of Akt alters artery specification via Notch signaling. (A) UMAP of Notch activity in WT and violin plot of Notch signaling activity in venous and arterial cells, obtained with AUCell (Mann–Whitney test). (B) UMAP of Notch activity in aktΔ/Δ venous and arterial cells, and violin plot of Notch activity in WT and aktΔ/Δ arterial cells (Mann–Whitney test). (C) In situ hybridization against deltaC in WT and aktΔ/Δ injected or not with endothelial cell-specific NICD (+fli1a:NICD) at 24 hpf [n=32 (WT), 43 (aktΔ/Δ) and 35 (aktΔ/Δ +fli1a:NICD) embryos; ordinary one-way ANOVA]. (D) Top: Live imaging of aktΔ/Δ embryos at 24 hpf injected or not with fli1a:mCherry, fli1a:akt1 or fli1a:NICDi. Arrowheads indicate connection between artery and vein. Dashed lines delineate the DA and PCV. Bottom: Quantification of the percentage of integration of each construct in the DA or PCV, DA and PCV diameters, and A/V connections [n=14 (aktΔ/Δ +fli1a:mCh), 13 (aktΔ/Δ +fli1a:NICD) and 11 (aktΔ/Δ +fli1a:akt1) embryos; ordinary one-way ANOVA]. All quantifications are represented as mean±s.e.m. DA, dorsal aorta; PCV, posterior cardinal vein.