
Fig. 3
- ID
- ZDB-IMAGE-240903-177
- Genes
- Antibodies
- Publication
- Zhou et al., 2024 - Akt is a mediator of artery specification during zebrafish development
- All Figures
- Figures for Zhou et al., 2024
|
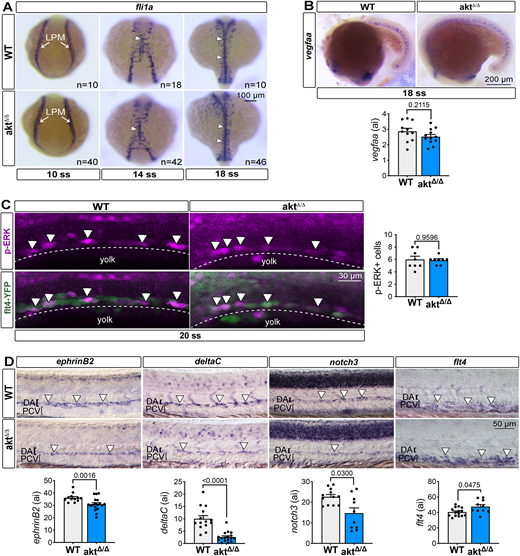
Fig. 3 Loss of Akt impedes artery specification, but not angioblast homing or ERK signaling. (A) In situ hybridization of the marker fli1a labels the position of angioblasts at 10 ss, 14 ss and 18 ss in WT and aktΔ/Δ embryos. White arrows point to the lateral plate mesoderm (LPM) at 10 ss and white arrowheads indicate the midline formation at 14 ss and 18 ss. (B) Top: In situ hybridization of vegfaa at 18 ss in WT and aktΔ/Δ embryos. Bottom: Graph showing vefgaa quantification. All values are divided by 10,000. n=11 (WT) and 11 (aktΔ/Δ) embryos; Mann–Whitney test. (C) Left: Lateral view of immunofluorescence images showing phosphorylated ERK in the DA of WT and aktΔ/Δ embryos in Tg(flt4:YFP)hu4881 embryos at 20 ss [n=8 (WT) and 8 (aktΔ/Δ) embryos; Mann–Whitney test]. Dotted lines represent the DA primordium and arrowheads indicate p-ERK+ cells. Right: Graph showing the number of p-ERK+ cells. (D) Top: In situ hybridization of the arterial markers ephrinB2 [n=12 (WT) and 18 (aktΔ/Δ) embryos], deltaC [n=14 (WT) and 17 (aktΔ/Δ) embryos] and notch3 [n=12 (WT) and 10 (aktΔ/Δ) embryos] and the venous marker flt4 [n=15 (WT) and 10 (aktΔ/Δ) embryos] at 24 hpf. Arrowheads indicate the region expressing the gene of interest. Bottom: Graph representing all gene expression quantification. All values are divided by 10,000; Mann–Whitney test. All quantifications are represented as mean±s.e.m. ai, arbitrary unit; DA, dorsal aorta; LPM, lateral plate mesoderm; PCV, posterior cardinal vein.