
Fig. 1
|
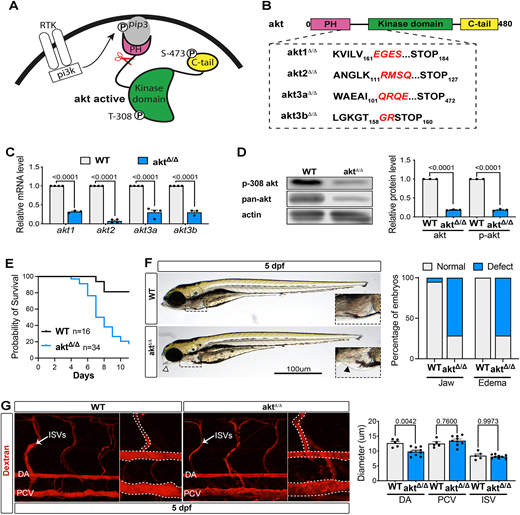
Fig. 1 Zebrafish model of Akt loss of function, aktΔ/Δ. (A) Schematic showing Akt activation downstream of receptor tyrosine kinase activation. Scissors represent the site where CRISPR/Cas9 will create mutations. (B) CRISPR/Cas9 strategy. Akt protein structure representation shows protein sequence alignment of wild-type (Akt) and mutant (aktΔ/Δ) zebrafish lines. Mutated sequences are shown in red. (C) qRT-PCR showing mRNA levels in WT and aktΔ/Δ embryos at 4 dpf. Expression levels were normalized to the WT (n=3 independent pools of 5 embryos; two-way ANOVA with Šídák's multiple comparisons test). (D) Western blot analysis of WT and aktΔ/Δ embryos at 4 dpf (n=3 independent pools of 20 embryos; ordinary one-way ANOVA with Tukey's multiple comparison). (E) Survival curve of WT and aktΔ/Δ mutants. (F) Left: Brightfield images of zebrafish WT and aktΔ/Δ embryos at 5 dpf. Arrowhead shows jaw defect and the boxed area is shown at higher magnification in insets to show edema defects in more detail. Right: Graph shows the percentage of embryos with jaw or edema defects in WT and aktΔ/Δembryos [n=20 (WT), 9 (aktΔ/Δ) embryos]. (G) Left: Images of live 5 dpf WT or aktΔ/Δ embryos injected with tetramethylrhodamine/dextran (2,000,000 molecular weight). The dashed lines indicate the perimeter of the vessels. Graph represents the DA, PCV and ISV diameter quantification [n=5 (WT), 9 (aktΔ/Δ) embryos; Mann–Whitney test]. All quantifications are represented as mean±s.e.m. P, phosphorylation; PH, pleckstrin homology domain; pi3k, phosphatidylinositol 3-kinase; pip3, phosphatidylinositol (3,4,5)-trisphosphate; RTK, receptor tyrosine kinase.