
Fig. 2
- ID
- ZDB-IMAGE-240903-176
- Genes
- Publication
- Zhou et al., 2024 - Akt is a mediator of artery specification during zebrafish development
- All Figures
- Figures for Zhou et al., 2024
|
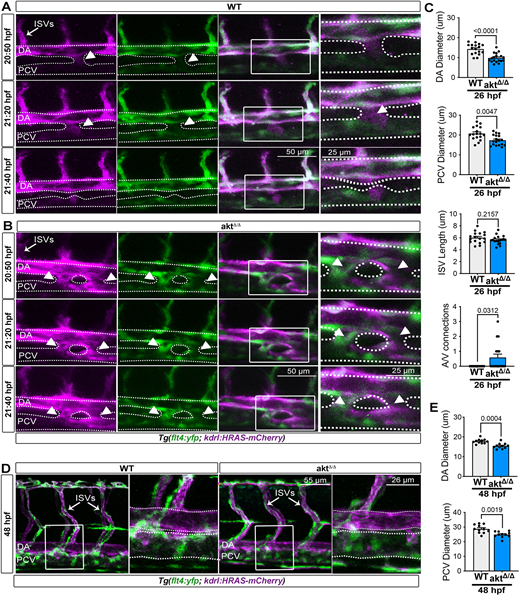
Fig. 2 aktΔ/Δ embryos exhibit early vascular defects. (A,B) Images from live time-lapse movies of WT (A) and aktΔ/Δ mutants (B) in Tg (flt4:YFP; kdrl:HRAS-mCherry)hu4881;s896 embryos (20-22 hpf). Time stamps are on the left of each panel. White arrowheads indicate connection between the artery and vein. See also Movies 1 and 2. (C) Quantification of DA and PCV diameters and ISV length as well as quantification of artery and vein connections [n=17 (WT) and 18 (aktΔ/Δ) embryos; Mann–Whitney test and Wilcoxon test for A/V connection]. (D) Lateral view (25×) live images of WT and aktΔ/Δ embryos at 48 hpf (trunk region) in Tg (flt4:YFP; kdrl:HRAS-mCherry)hu4881;s896. (E) Quantification of DA and PCV diameters in WT and aktΔ/Δ mutants [n=17 (WT) and 18 (aktΔ/Δ) embryos; Mann–Whitney test]. All quantifications are represented as mean±s.e.m. In A.B,D, images on the right are magnified views of the boxed regions to the left, and dotted lines outline vessel perimeters. A/V, artery and vein; DA, dorsal aorta; ISVs, intersegmental vessels; PCV, posterior cardinal vein.