FIGURE SUMMARY
Title

Integrated mRNA- and miRNA-sequencing analyses unveil the underlying mechanism of tobacco pollutant-induced developmental toxicity in zebrafish embryos

Authors
Chen, J., Lin, Y., Gen, D., Chen, W., Han, R., Li, H., Tang, S., Zheng, S., Zhong, X.
Source
Full text @ J Transl Med

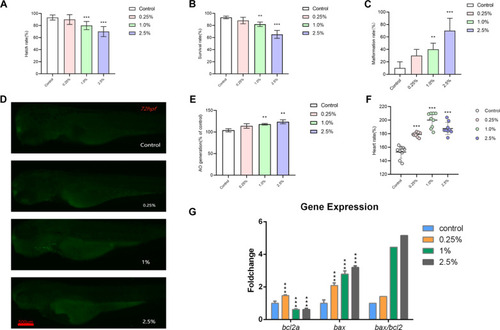
Toxic effects of CSE on the development of zebrafish embryos. The hatching rate (A), survival rate (B) and malformation rate (C) of zebrafish larvae exposed to various concentrations of CSE (0, 0.25, 1 and 2.5%) for 96 hpf. Lateral view (D) and the relative fluorescence intensities (E) of bright spots region in control and CES-exposure groups in 96-hpf larvae after AO staining. The heart rate of zebrafish larvae exposed to various concentrations of CSE (0, 0.25, 1 and 2.5%) for 96 hpf (F). Expression of apoptosis-related genes (Bcl-2, Bax, Bax/Bcl-2) in the 96-hpf zebrafish larvae after CSE exposure by qRT-PCR (G). Results were presented as the mean ± SD of three independent experiments. Each group included 3 replicates (10 larvae/replicate). *P < 0.05, **P < 0.01, ***P < 0.001 compared with the control group

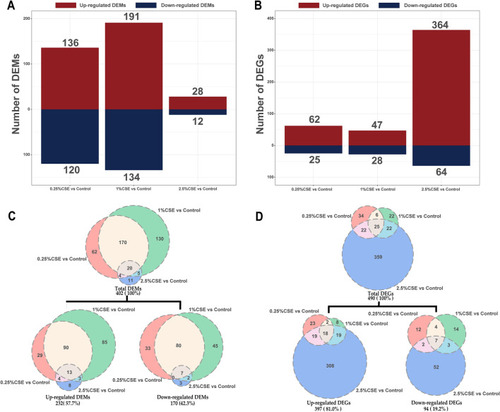
Effects of mRNA and miRNA transcriptome alterations by CSE exposure. The column diagram displaying the DEM and DEG counts (A, B). The overlaps of the DEM and DEG sets from the three comparison groups (0.25% CSE vs control, 1% CSE vs control, and 2.5% CSE vs control) shown in the Venn diagram (C, D). For a more thorough breakdown of DEMs and DEGs distribution, see Additional file 3: Fig. S2

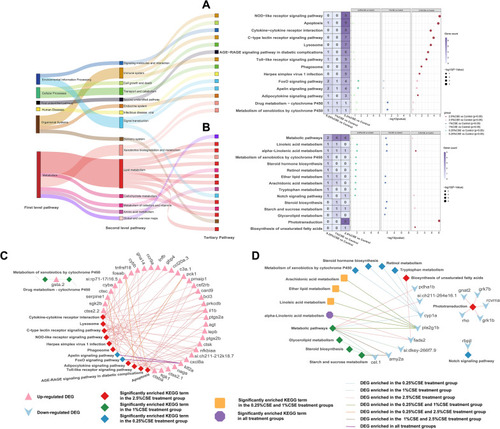
Effect of CSE exposure on KEGG functional enrichment in DEG group. Total significant KEGG pathways in DEGs with increased (A) and decreased expression (B) respectively. The tertiary pathways of the KEGG findings are classified in the left Sankey diagram. The quantity of DEGs enriched in the depicted pathways was shown on the purple Heat maps. Gene-term networks illustrating the connection between enriched DEGs and both up-regulated (C) and down-regulated (D) KEGG terms

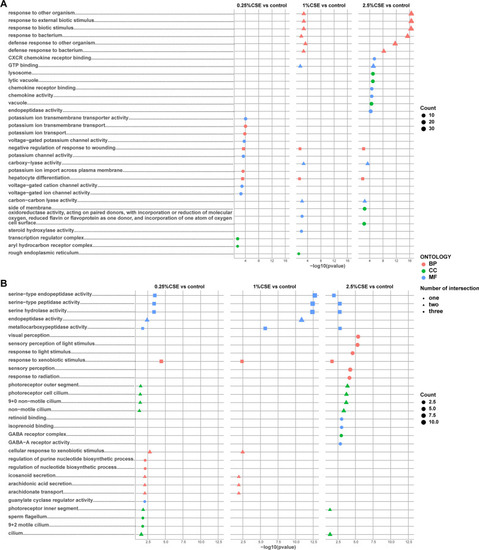
GO functional enrichment analysis in DEG group exposed by CSE. Top 5 GO terms of MF, CC, and BP categories with the greatest significance in up-regulated (A) and down-regulated (B) DEGs of three different concentration treatments exposed by CSE. MF Molecular Function, CC cellular component, and BP biological process

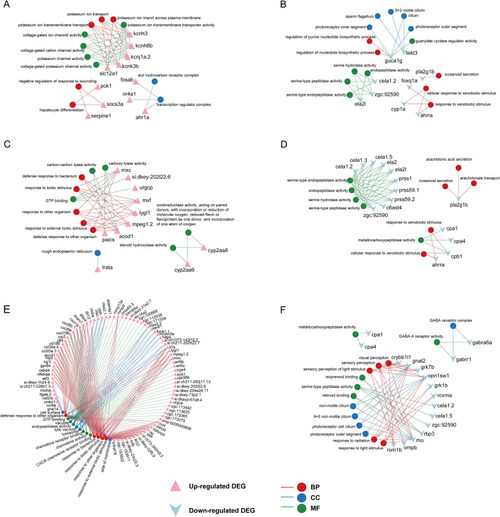
The relation between enriched GO term and involved gene in DEG group. Gene-term networks in up- and down-regulated GO terms in 0.25% CSE vs control (A, B), 1% CSE vs control (C, D), and 2.5% CSE vs control (E, F). GO terms are top 5 GO terms of MF, CC, and BP categories with the greatest significance in up-regulated and down-regulated DEGs of three treatment groups. MF Molecular Function, CC cellular component, and BP biological process

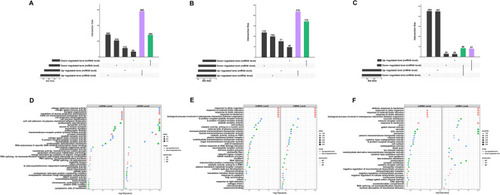
The GSEA results enriched by three gene datasets from various concentration treatments treated by CSE. Top 10 KEGG terms with the highest NES in 0.25% CSE vs control (A), 1% CSE vs control (B), and 2.5% CSE vs control (C). Top 5 GO terms of the MF, CC, and BP categories with the largest NES in 0.25% CSE vs control (D), 1% CSE vs control (E), and 2.5% CSE vs control (F).The horizontal bar length corresponds to the magnitude of the p-value, while the lines show changes in the enriched gene count

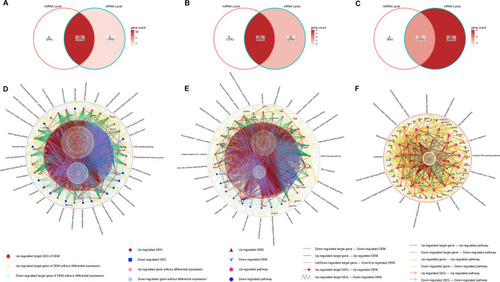
GSEA-KEGG terms interconnected between miRNA and mRNA levels. Venn diagram of KEGG terms in 0.25%CSE vs control (A), 1%CSE vs control (B), and 2.5%CSE vs control (C). The miRNA–mRNA–pathway networks for 0.25%CSE vs control (D), 1%CSE vs control (E), and 2.5%CSE vs control (F)

GSEA-GO terms interconnected between miRNA and mRNA levels. Intersected GO terms between miRNA and mRNA levels in 0.25% CSE vs control (A), 1% CSE vs control (B), and 2.5% CSE vs control (C). The upset plot mainly focused on the crossroads scenario. The specifics of the intersecting GO terms were presented in dot plots (DF). MF Molecular Function, CC cellular component, and BP biological process

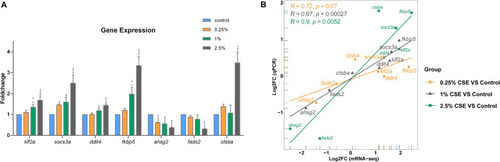
RT-qPCR verification of the chosen DEGs' expression. The bar graph with various groups showing the relative levels of gene expression (A). The linear regression figure depicting the DEGs’ expression consistency between qPCR and sequencing data (B)

Acknowledgments
This image is the copyrighted work of the attributed author or publisher, and ZFIN has permission only to display this image to its users. Additional permissions should be obtained from the applicable author or publisher of the image. Full text @ J Transl Med