
Image
|
Figure Caption
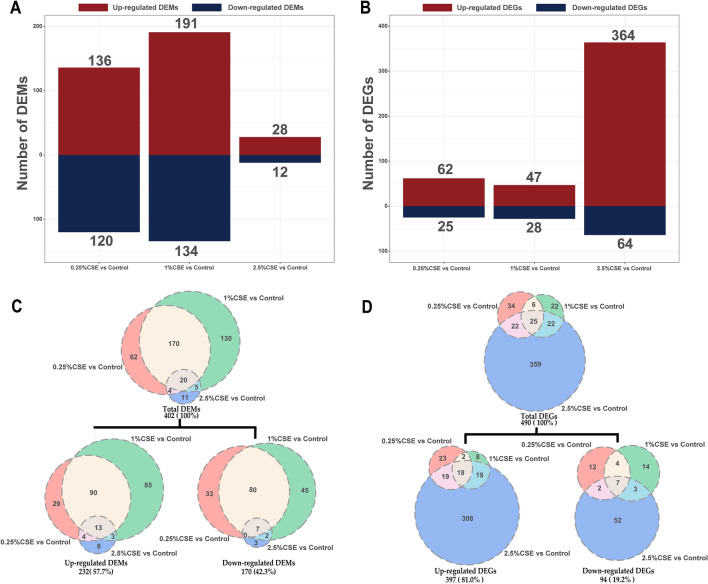
Fig. 2
Effects of mRNA and miRNA transcriptome alterations by CSE exposure. The column diagram displaying the DEM and DEG counts (
Acknowledgments
This image is the copyrighted work of the attributed author or publisher, and
ZFIN has permission only to display this image to its users.
Additional permissions should be obtained from the applicable author or publisher of the image.
Full text @ J Transl Med