
FIGURE
Fig. 9
- ID
- ZDB-FIG-240311-25
- Publication
- Chen et al., 2024 - Integrated mRNA- and miRNA-sequencing analyses unveil the underlying mechanism of tobacco pollutant-induced developmental toxicity in zebrafish embryos
- Other Figures
- All Figure Page
- Back to All Figure Page
Fig. 9
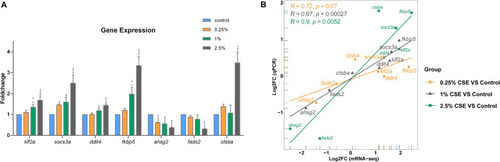
RT-qPCR verification of the chosen DEGs' expression. The bar graph with various groups showing the relative levels of gene expression ( |
Expression Data
Expression Detail
Antibody Labeling
Phenotype Data
Phenotype Detail
Acknowledgments
This image is the copyrighted work of the attributed author or publisher, and
ZFIN has permission only to display this image to its users.
Additional permissions should be obtained from the applicable author or publisher of the image.
Full text @ J Transl Med