
Image
|
Figure Caption
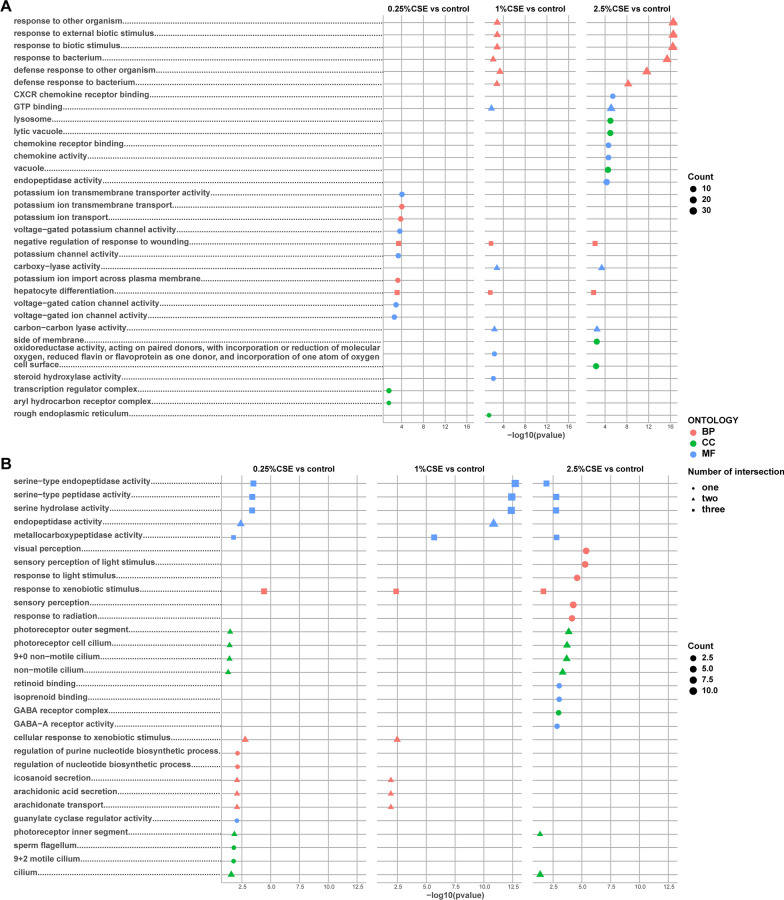
Fig. 4
GO functional enrichment analysis in DEG group exposed by CSE. Top 5 GO terms of MF, CC, and BP categories with the greatest significance in up-regulated (
Acknowledgments
This image is the copyrighted work of the attributed author or publisher, and
ZFIN has permission only to display this image to its users.
Additional permissions should be obtained from the applicable author or publisher of the image.
Full text @ J Transl Med