
Image
|
Figure Caption
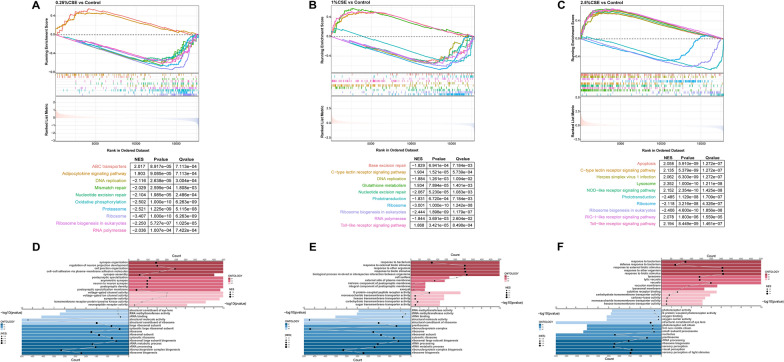
Fig. 6
The GSEA results enriched by three gene datasets from various concentration treatments treated by CSE. Top 10 KEGG terms with the highest NES in 0.25% CSE vs control (
Acknowledgments
This image is the copyrighted work of the attributed author or publisher, and
ZFIN has permission only to display this image to its users.
Additional permissions should be obtained from the applicable author or publisher of the image.
Full text @ J Transl Med