
Image
|
Figure Caption
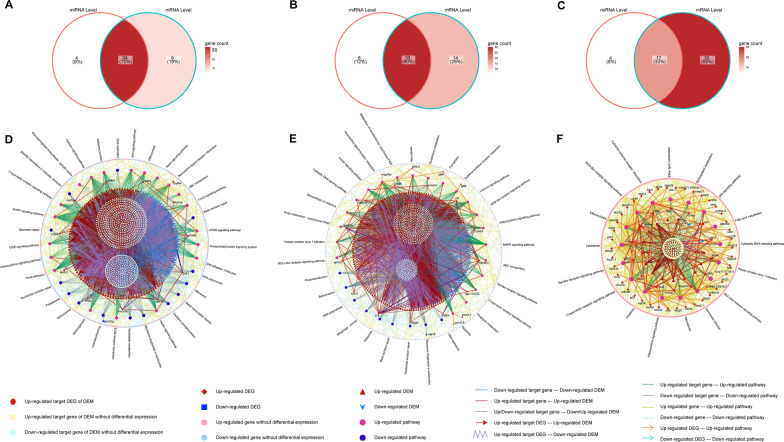
Fig. 7
GSEA-KEGG terms interconnected between miRNA and mRNA levels. Venn diagram of KEGG terms in 0.25%CSE vs control (
Acknowledgments
This image is the copyrighted work of the attributed author or publisher, and
ZFIN has permission only to display this image to its users.
Additional permissions should be obtained from the applicable author or publisher of the image.
Full text @ J Transl Med