
Image
|
Figure Caption
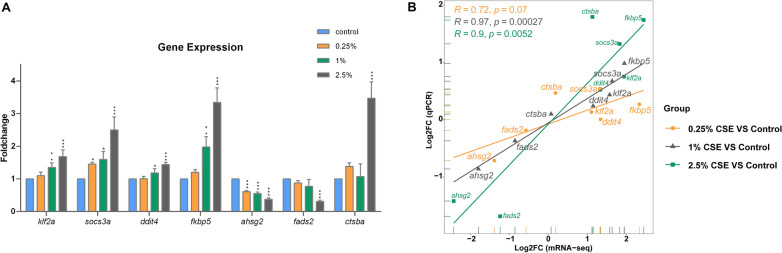
Fig. 9
RT-qPCR verification of the chosen DEGs' expression. The bar graph with various groups showing the relative levels of gene expression (
Acknowledgments
This image is the copyrighted work of the attributed author or publisher, and
ZFIN has permission only to display this image to its users.
Additional permissions should be obtained from the applicable author or publisher of the image.
Full text @ J Transl Med