IMAGE

Fig. 1

ID
ZDB-IMAGE-240311-27
Source
Figures for Chen et al., 2024
Image
Figure Caption

Fig. 1

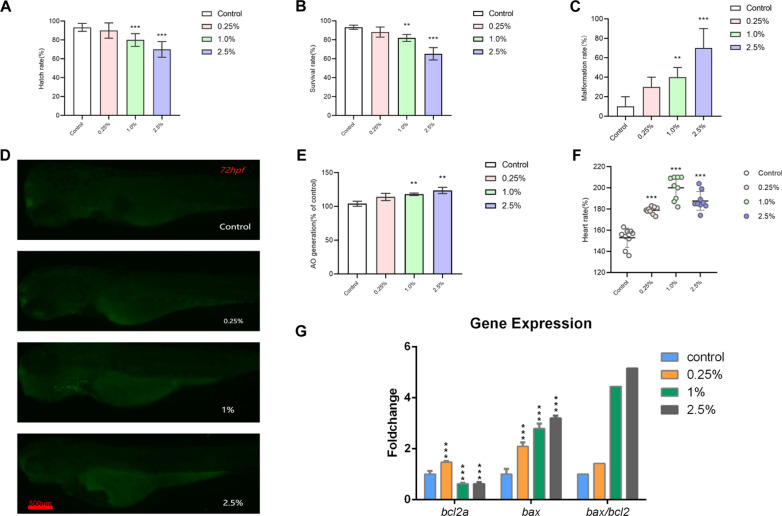
Toxic effects of CSE on the development of zebrafish embryos. The hatching rate (A), survival rate (B) and malformation rate (C) of zebrafish larvae exposed to various concentrations of CSE (0, 0.25, 1 and 2.5%) for 96 hpf. Lateral view (D) and the relative fluorescence intensities (E) of bright spots region in control and CES-exposure groups in 96-hpf larvae after AO staining. The heart rate of zebrafish larvae exposed to various concentrations of CSE (0, 0.25, 1 and 2.5%) for 96 hpf (F). Expression of apoptosis-related genes (Bcl-2, Bax, Bax/Bcl-2) in the 96-hpf zebrafish larvae after CSE exposure by qRT-PCR (G). Results were presented as the mean ± SD of three independent experiments. Each group included 3 replicates (10 larvae/replicate). *P < 0.05, **P < 0.01, ***P < 0.001 compared with the control group

Acknowledgments
This image is the copyrighted work of the attributed author or publisher, and ZFIN has permission only to display this image to its users. Additional permissions should be obtained from the applicable author or publisher of the image. Full text @ J Transl Med