
Image
|
Figure Caption
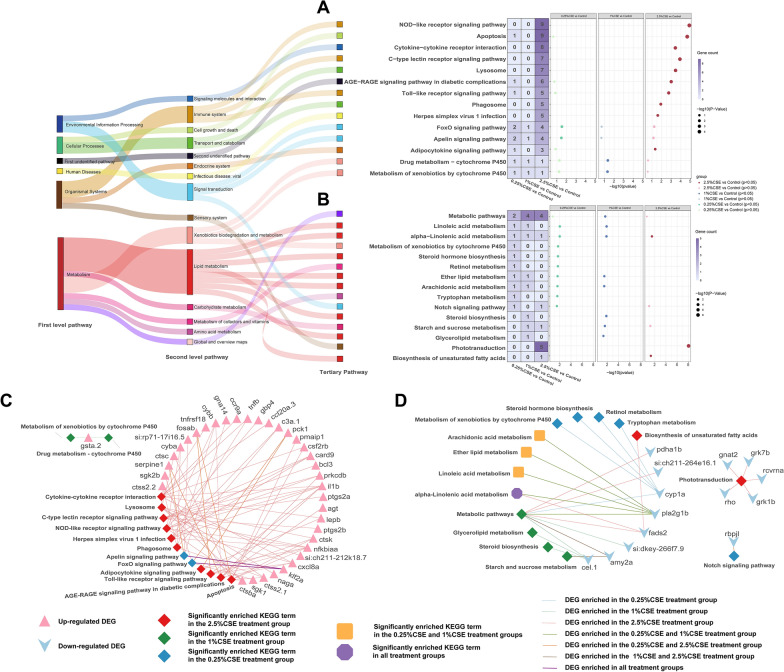
Fig. 3
Effect of CSE exposure on KEGG functional enrichment in DEG group. Total significant KEGG pathways in DEGs with increased (
Acknowledgments
This image is the copyrighted work of the attributed author or publisher, and
ZFIN has permission only to display this image to its users.
Additional permissions should be obtained from the applicable author or publisher of the image.
Full text @ J Transl Med