- Title
-
Establishment of a Diamond-Blackfan anemia like model in zebrafish
- Authors
- Ling, Y., Wu, J., Liu, Y., Meng, P., Sun, Y., Zhao, D., Lin, Q.
- Source
- Full text @ Dev. Dyn.
|
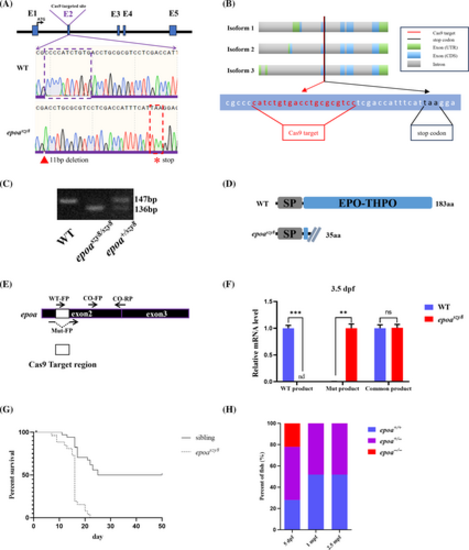
Generation of epoa mutant zebrafish by genomic editing using CRISPR/Cas9. (A) A 11-bp deletion and 0-bp addition in epoa exon 2 were identified in CRISPR/Cas9 generated mutants, which predicted a stop codon. (B) Schematic representation of the three epoa transcripts, with the position of the Cas9 target in red and the new stop codon appearing after deletion of 11 bp in black. (C) DNA agarose gel electrophoresis to distinguish WT, epoaszy8 and epoa+/szy8. (D) Protein structure prediction shows that the main erythropoietin (EPO)-THPO domain is completely truncated. (E and F) epoaΔ11,+0 mutated transcripts generated in epoaszy8 mutants. Primer pairs WT-FP/CO-RP, Mut-FP/CO-RP and CO-FP/CO-RP were used to detect WT and epoaszy8 genotypes, respectively. Statistical significance was determined using a two sample Student's t-test, n ≥ 15 per group, and data were combined from four replicates, mean ± SEM, nd: no detective, *p < .05, **p < .001 and ***p < .001. (G) Survival curves of the epoa mutant and its siblings. (H) Percentage of epoa+/+, epoa+/− and epoa−/− zebrafish survival at 5 dpf, 1 mpf and 2.5 mpf (n = 27–120 embryos/larvae/fish). EXPRESSION / LABELING:
PHENOTYPE:
|
|
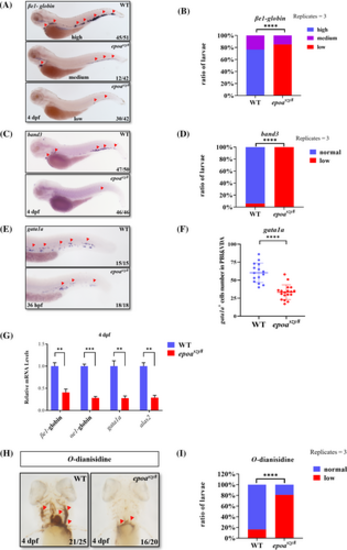
The epoaszy8 model present severe embryonic anemia. (A–D) βe1-globin WISH (A and B, indicated by red triangular arrowheads) and band3 WISH (C and D, indicated by red triangular arrowheads) marked erythrocytes at 4 days post fertilization (dpf) in epoaszy8 compared with WT. The larvae were initially genotyped and then divided into three or two groups based on their expression levels. (Student's t-test, mean ± SEM, replicates = 3, n > 3, ****p < .0001). (E and F) gata1a WISH (E, indicated by red triangular arrowheads) identified erythroid progenitor cells at 36 h post fertilization (hpf) in epoaszy8 compared with WT (Student's t-test, mean ± SD, n ≥ 6, ****p < .0001). (G) Relative expression of erythroid cells markers in 4 dpf WT (blue column) and epoaszy8 (red column) quantified by RT-qPCR. Statistical significance was determined using a two-sample Student's t-test, n ≥ 15 per group, and data were combined from four replicates, mean ± SEM, **p < .01 and ***p < .001. (H and I) O-dianisidine staining (H, indicated by red triangular arrowheads) identified hemoglobin at 4 dpf (Student's t-test, mean ± SEM, replicates = 3, n ≥ 5, ****p < .0001). |
|
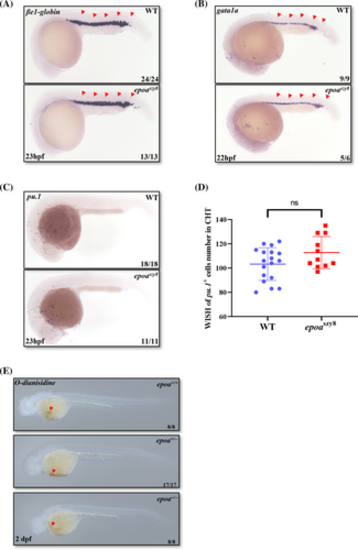
No alterations in primitive hematopoietic lineages in epoaszy8. (A) βe1-globin WISH (indicated by red triangular arrowheads) identified erythroid progenitor cells at 23-hpf in epoaszy8 compared with WT (Fisher's exact test, n > 10, ns: no significance). (B) gata1a WISH (indicated by red triangular arrowheads) identified erythroid progenitor cells at 22-hpf in epoaszy8 compared with WT (Fisher's exact test, n ≥ 6, ns: no significance). (C and D) pu.1 WISH (C) identified primitive myeloid cells at 23 hpf in epoaszy8 compared with WT (Student's t-test, n > 10, mean ± SD, ns: no significance). (E) O-dianisidine staining (indicated by red triangular arrowheads) identified hemoglobin at 2 dpf. EXPRESSION / LABELING:
PHENOTYPE:
|
|
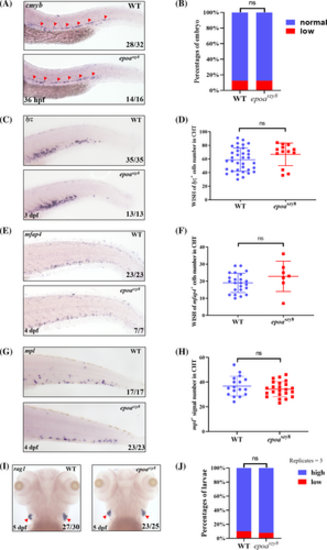
No alterations in other definitive hematopoietic lineages in epoaszy8. (A and B) cmyb WISH (A, indicated by red triangular arrowheads) identified HSPCs at 36-hpf in epoaszy8 compared with WT (Fisher's exact test, n ≥ 8, ns: no significance). (C and D) lyz WISH (C, indicated by red triangular arrowheads) identified granulocytes at 3-dpf in epoaszy8 compared with WT (Student's t-test, n > 8, mean ± SD, ns: no significance). (E and F) mfap4 WISH (E, indicated by red triangular arrowheads) identified macrophages at 4-dpf in epoaszy8 compared with WT (Student's t-test, n > 6, mean ± SD, ns: no significance). (G and H) mpl WISH (G, indicated by red triangular arrowheads) identified thrombocytes at 4-dpf in epoaszy8 compared with WT (Student's t-test, n > 15, mean ± SD, ns: no significance). (I and J) rag1 WISH (I, indicated by red triangular arrowheads) identified lymphocytes at 5-dpf in epoaszy8 compared with WT (Student's t-test, n > 6, replicates = 3, mean ± SEM, ns: no significance). |
|
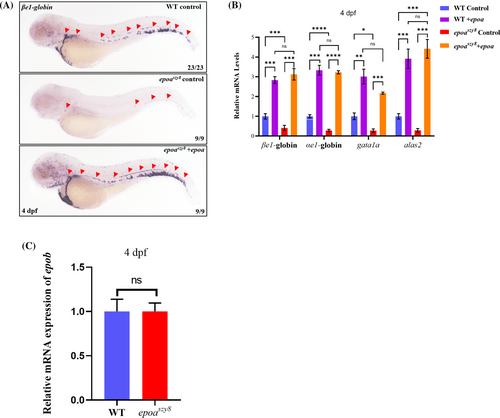
The epoa mRNA overexpression rescued anemia in epoaszy8. (A) WISH of 4-dpf larvae injected with epoa mRNA. Larvae of epoaszy8 are completely rescued by epoa mRNA to WT level. Representative images are shown for staining of βe1-globin (indicated by red triangular arrowheads) in 4-dpf WT and epoaszy8 larvae. (B) Relative expression of erythroid cells markers in 4-dpf WT control group (blue column), WT epoa mRNA injection group (WT + epoa, purple column), epoaszy8 control group (red column) and epoaszy8 + epoa group (orange column) quantified by RT-qPCR. Statistical significance was determined using a two-sample Student's t-test, n ≥ 15 per group, and data were combined from four replicates, mean ± SEM, ns: no significance, *p < .05, **p < .01, ***p < .001 and ****p < .0001. (C) Relative expression of epob in 4 dpf WT and epoaszy8 quantified by RT-qPCR. Statistical significance was determined using a two-sample Student's t-test, n ≥ 15 per group, mean ± SEM, ns: no significance. |
|
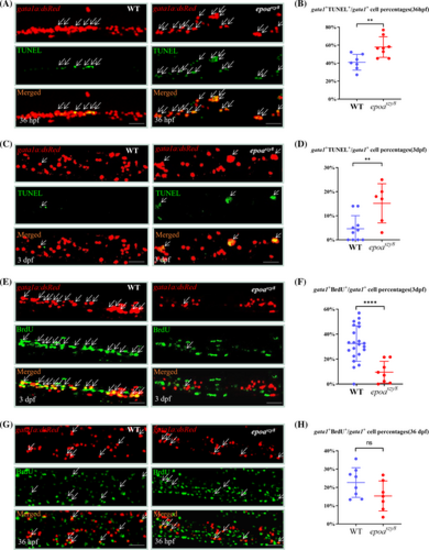
Abated erythrocyte precursor cellular proliferation and increased erythrocyte precursor cellular apoptosis in epoaszy8. (A and B) Profiling of TUNEL incorporation by PBI&VDA gata1a:DsRed+ cells in 36 hpf Tg(gata1a:DsRed);WT (A, left panel) and Tg(gata1a:DsRed);epoaszy8 (A, right panel) by double antibody staining of TUNEL (green signals) and DsRed (red signals). White arrow heads indicate the yellow color merged signals represent the TUNEL+gata1a+ cells. Scale bars: 50 μm. Statistical data showing the percentages of PBI&VDA localized gata1a:eGFP+ cells (B) incorporated TUNEL. Asterisks indicate statistical difference. Statistical significance was determined using a two-sample Student's t-test, n ≥ 7, mean ± SD, **p < .01. (C and D) Profiling of TUNEL incorporation by CHT gata1a:DsRed+ cells in 3 dpf Tg(gata1a:DsRed);WT (C, left panel) and Tg(gata1a:DsRed);epoaszy8 (C, right panel) by double antibody staining of TUNEL (green signals) and DsRed (red signals). White arrow heads indicate the yellow color merged signals represent the TUNEL+gata1a+ cells. Scale bars: 50 μm. Statistical data showing the percentages of CHT localized gata1a:eGFP+ cells (D) incorporated TUNEL. Asterisks indicate statistical difference. Statistical significance was determined using a two-sample Student's t-test, n ≥ 6, mean ± SD, **p < .01. (E and F) Profiling of BrdU incorporation by CHT gata1a:DsRed+ cells in 3 dpf Tg(gata1a:DsRed);WT (E, left panel) and Tg(gata1a:DsRed); epoaszy8 (E, right panel) by double antibody staining of BrdU (green signals) and DsRed (red signals). White arrow heads indicate the yellow color merged signals represent the BrdU+gata1a+ cells. Scale bars: 50 μm. Statistical data showing the percentages of CHT localized gata1a:eGFP+ cells (F) incorporated BrdU. Asterisks indicate statistical difference. Statistical significance was determined using a two-sample Student's t-test, n ≥ 8, mean ± SD, ****p < .0001. (G and H) Profiling of BrdU incorporation by PBI&VDA gata1a:DsRed+ cells in 36 hpf Tg(gata1a:DsRed);WT (D, left) and Tg(gata1a:DsRed); epoaszy8 (G, right) by double antibody staining of BrdU (green signals) and DsRed (red signals). White arrow heads indicate the yellow color merged signals represent the BrdU+gata1a+ cells. Scale bars: 50 μm. Statistical data showing the percentages of CHT localized gata1a:eGFP+ cells (H) incorporated BrdU. Asterisks indicate statistical difference. Statistical significance was determined using a two-sample Student's t-test, n ≥ 7, mean ± SD, ns: no significance. PHENOTYPE:
|
|
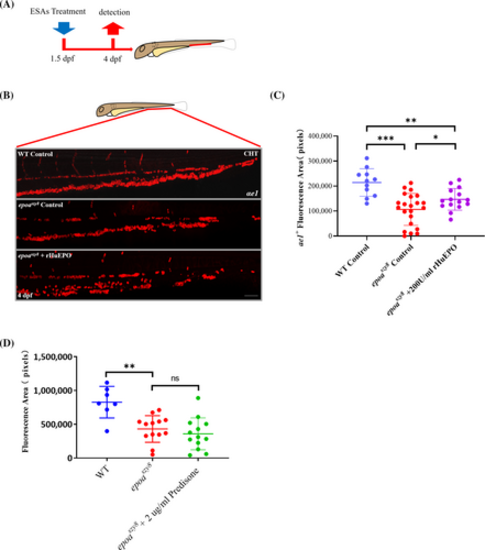
ESA responses of epoaszy8. (A) Schematic diagram of the ESA treatment. The embryos were exposed to rHuEPO at 1.5-dpf and fixed at 4-dpf from epoaheterozygous intercross. (B) Anemia indicated by decreased αe1+ cells in epoaszy8 larvae, and the erythrocytes expansion by rHuEPO. Images of WT and epoaszy8 embryos treated with sodium chloride salin control and rHuEPO (C) Statistical significance was determined using a two-sample Student's t-test, n > 10, mean ± SD, *p < .05, **p < .01, ***p < .001. Scale bars: 50 μm. (D) Predisone responses of epoaszy8, statistical significance was determined using a two-sample Student's t-test, n ≥ 7, mean ± SD, ns: no significance. PHENOTYPE:
|
|
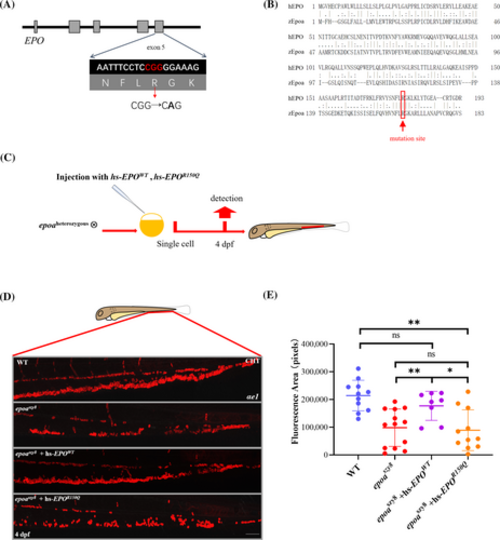
Human EPO variants assessment in epoaszy8. (A) Location of the R150Q EPO mutation in genomic sequence. The mutation is highlighted and marked with a red arrow in the sequence below. (B) Amino acid sequence alignment of human EPO and zebrafish Epoa, location of the R150Q EPO mutation is marked with a red line in the sequence. (C) Schematic diagram of the validation of epoaszy8 model using human DBAL related EPO mutation. The hsEPOWT, hsEPO530G>A mRNA were injected into one cell of the embryos from epoaheterozygous intercross. (D) Antibody staining of αe1+ cells in CHT of 4-dpf larvae injected with human hsEPOWT mRNA, hsEPO530G>A mRNA. (E) Statistical significance was determined using a two-sample Student's t-test, n ≥ 8, mean ± SD, ns: not significant, *p < .05 and **p < .01. Scale bars: 50 μm. PHENOTYPE:
|

