|
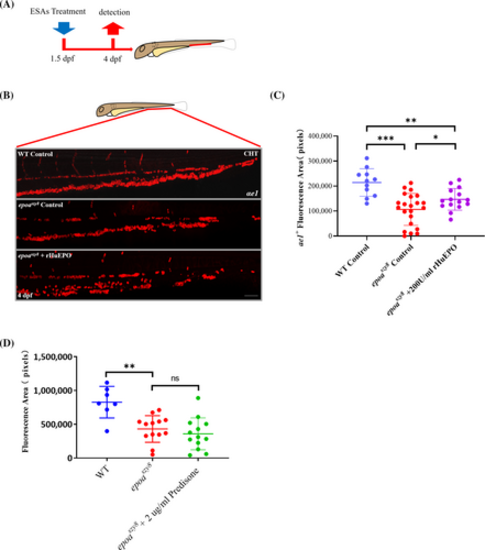
ESA responses of epoaszy8. (A) Schematic diagram of the ESA treatment. The embryos were exposed to rHuEPO at 1.5-dpf and fixed at 4-dpf from epoaheterozygous intercross. (B) Anemia indicated by decreased αe1+ cells in epoaszy8 larvae, and the erythrocytes expansion by rHuEPO. Images of WT and epoaszy8 embryos treated with sodium chloride salin control and rHuEPO (C) Statistical significance was determined using a two-sample Student's t-test, n > 10, mean ± SD, *p < .05, **p < .01, ***p < .001. Scale bars: 50 μm. (D) Predisone responses of epoaszy8, statistical significance was determined using a two-sample Student's t-test, n ≥ 7, mean ± SD, ns: no significance.
|