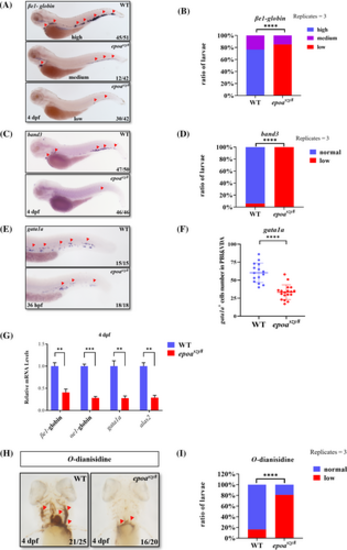
The epoaszy8 model present severe embryonic anemia. (A–D) βe1-globin WISH (A and B, indicated by red triangular arrowheads) and band3 WISH (C and D, indicated by red triangular arrowheads) marked erythrocytes at 4 days post fertilization (dpf) in epoaszy8 compared with WT. The larvae were initially genotyped and then divided into three or two groups based on their expression levels. (Student's t-test, mean ± SEM, replicates = 3, n > 3, ****p < .0001). (E and F) gata1a WISH (E, indicated by red triangular arrowheads) identified erythroid progenitor cells at 36 h post fertilization (hpf) in epoaszy8 compared with WT (Student's t-test, mean ± SD, n ≥ 6, ****p < .0001). (G) Relative expression of erythroid cells markers in 4 dpf WT (blue column) and epoaszy8 (red column) quantified by RT-qPCR. Statistical significance was determined using a two-sample Student's t-test, n ≥ 15 per group, and data were combined from four replicates, mean ± SEM, **p < .01 and ***p < .001. (H and I) O-dianisidine staining (H, indicated by red triangular arrowheads) identified hemoglobin at 4 dpf (Student's t-test, mean ± SEM, replicates = 3, n ≥ 5, ****p < .0001).
|
