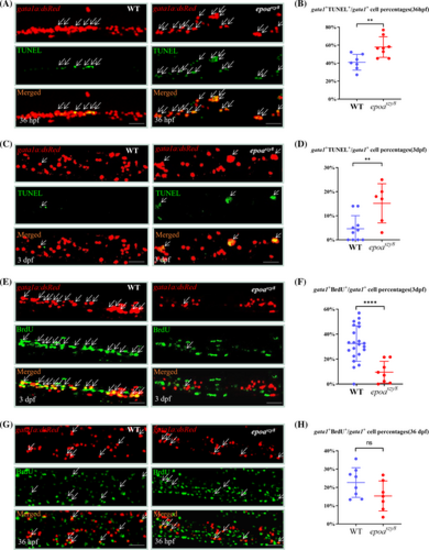
Abated erythrocyte precursor cellular proliferation and increased erythrocyte precursor cellular apoptosis in epoaszy8. (A and B) Profiling of TUNEL incorporation by PBI&VDA gata1a:DsRed+ cells in 36 hpf Tg(gata1a:DsRed);WT (A, left panel) and Tg(gata1a:DsRed);epoaszy8 (A, right panel) by double antibody staining of TUNEL (green signals) and DsRed (red signals). White arrow heads indicate the yellow color merged signals represent the TUNEL+gata1a+ cells. Scale bars: 50 μm. Statistical data showing the percentages of PBI&VDA localized gata1a:eGFP+ cells (B) incorporated TUNEL. Asterisks indicate statistical difference. Statistical significance was determined using a two-sample Student's t-test, n ≥ 7, mean ± SD, **p < .01. (C and D) Profiling of TUNEL incorporation by CHT gata1a:DsRed+ cells in 3 dpf Tg(gata1a:DsRed);WT (C, left panel) and Tg(gata1a:DsRed);epoaszy8 (C, right panel) by double antibody staining of TUNEL (green signals) and DsRed (red signals). White arrow heads indicate the yellow color merged signals represent the TUNEL+gata1a+ cells. Scale bars: 50 μm. Statistical data showing the percentages of CHT localized gata1a:eGFP+ cells (D) incorporated TUNEL. Asterisks indicate statistical difference. Statistical significance was determined using a two-sample Student's t-test, n ≥ 6, mean ± SD, **p < .01. (E and F) Profiling of BrdU incorporation by CHT gata1a:DsRed+ cells in 3 dpf Tg(gata1a:DsRed);WT (E, left panel) and Tg(gata1a:DsRed); epoaszy8 (E, right panel) by double antibody staining of BrdU (green signals) and DsRed (red signals). White arrow heads indicate the yellow color merged signals represent the BrdU+gata1a+ cells. Scale bars: 50 μm. Statistical data showing the percentages of CHT localized gata1a:eGFP+ cells (F) incorporated BrdU. Asterisks indicate statistical difference. Statistical significance was determined using a two-sample Student's t-test, n ≥ 8, mean ± SD, ****p < .0001. (G and H) Profiling of BrdU incorporation by PBI&VDA gata1a:DsRed+ cells in 36 hpf Tg(gata1a:DsRed);WT (D, left) and Tg(gata1a:DsRed); epoaszy8 (G, right) by double antibody staining of BrdU (green signals) and DsRed (red signals). White arrow heads indicate the yellow color merged signals represent the BrdU+gata1a+ cells. Scale bars: 50 μm. Statistical data showing the percentages of CHT localized gata1a:eGFP+ cells (H) incorporated BrdU. Asterisks indicate statistical difference. Statistical significance was determined using a two-sample Student's t-test, n ≥ 7, mean ± SD, ns: no significance.
|

