
- Title
-
IL-6 Mutation Attenuates Liver Injury Caused by Aeromonas hydrophila Infection by Reducing Oxidative Stress in Zebrafish
- Authors
- Zhai, W., Wang, Z., Ye, C., Ke, L., Wang, H., Liu, H.
- Source
- Full text @ Int. J. Mol. Sci.

ZFIN is incorporating published figure images and captions as part of an ongoing project. Figures from some publications have not yet been curated, or are not available for display because of copyright restrictions. PHENOTYPE:
|
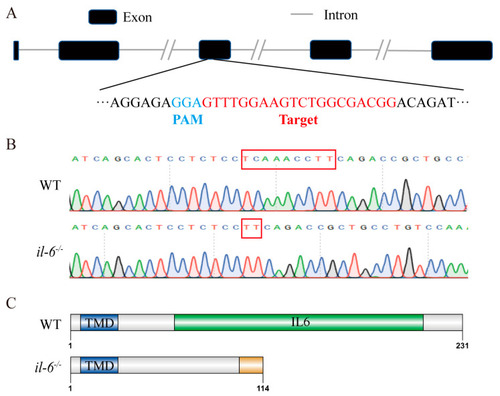
Generation of |
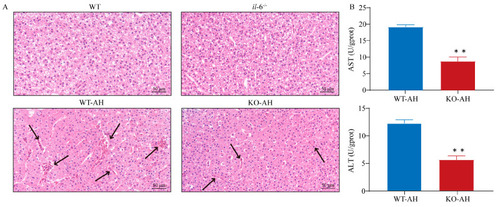
Liver injury in WT and PHENOTYPE:
|

Analysis and qPCR validation of liver transcriptome data from the WT and |
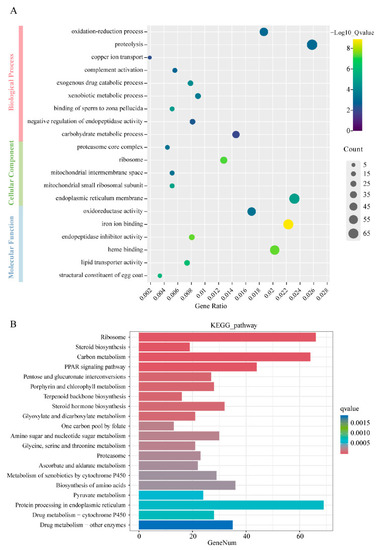
GO and KEGG pathway enrichment analysis of DEGs. ( |
Effect of PHENOTYPE:
|
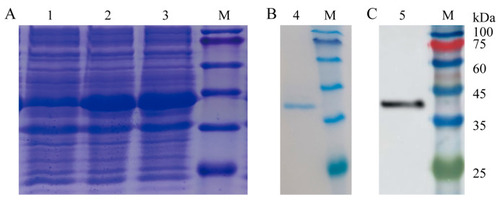
Expression and purification of recombinant zebrafish IL-6 (rDrIL-6) protein. ( |
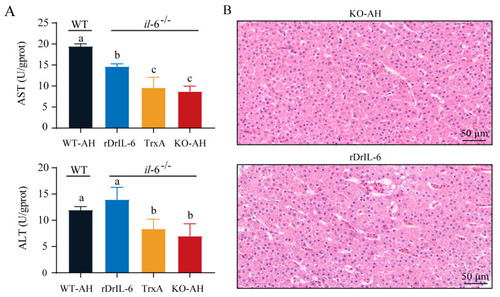
Effect of rDrIL-6 protein on liver injury induced by PHENOTYPE:
|
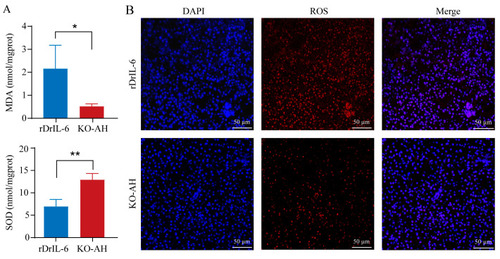
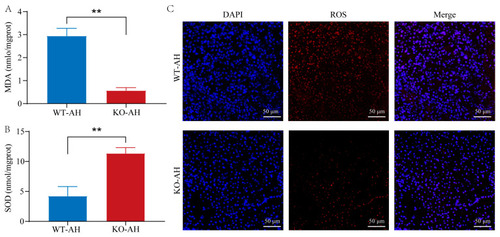
Effect of rDrIL-6 protein on liver oxidative stress in |