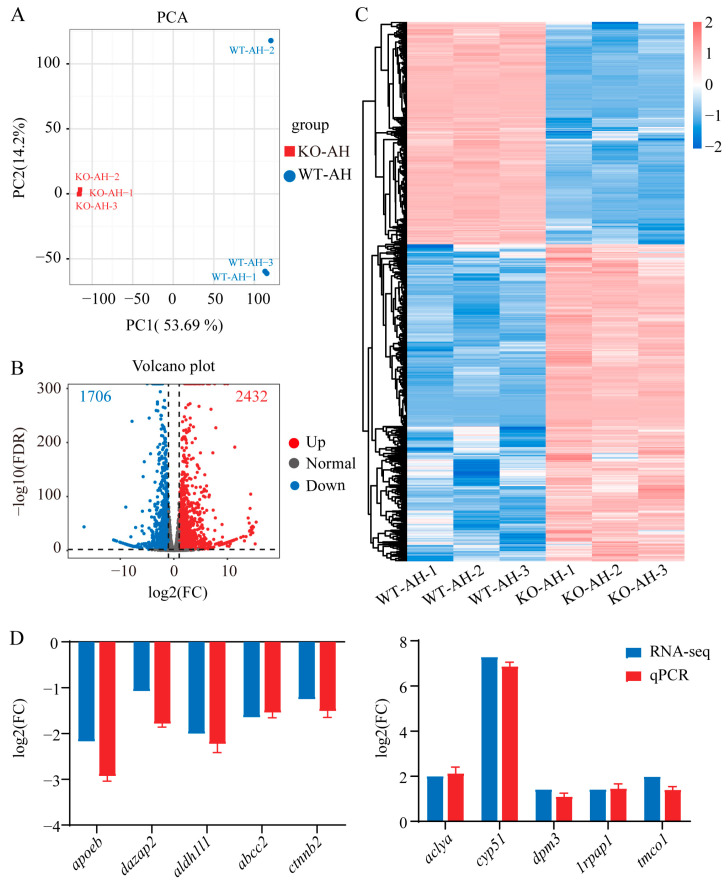
IMAGE

Figure 3

ID
ZDB-IMAGE-231225-116
Source
Figures for Zhai et al., 2023
Image
Figure Caption

Figure 3

Analysis and qPCR validation of liver transcriptome data from the WT and il-6−/− zebrafish after A. hydrophila infection. (A) Principal component analysis (PCA) on the liver transcriptome data of WT and il-6−/− zebrafish after A. hydrophila infection. Volcano plots (B) and heatmap clustering (C) of differentially expressed genes (DEGs). The points of the blue represent down-regulated genes, the points of the red represent up-regulated genes, and the gray points represent genes without significant change. The results showed that the transcriptome of the KO-AH group was significantly different from that of the WT-AH group. (D) Validation of transcriptome data using qPCR. Ten genes were randomly selected. The relative expression levels were identified by qPCR (blue column) and plotted against the expression levels from the transcriptome data (red column). The qPCR results demonstrated strong concordance with the transcriptome data, confirming the reliability of the transcriptome data. apoeb: apolipoprotein Eb; dazap2: azoospermia-associated protein 2; aldh1l1: aldehyde dehydrogenase 1L1; abcc2: ATP-binding cassette-2; ctnmb2: catenin, beta 2; aclya: ATP citrate lyase a; cyp51: sterol 14α-demethylase; dpm3: dolichol-phosphate-mannose-3; lrpap1: low-density lipoprotein receptor-related protein-associated protein 1; tmco1: transmembrane and coiled-coil domains 1. WT-AH: WT zebrafish treated with A. hydrophila; KO-AH: il-6−/− zebrafish treated with A. hydrophila.

Acknowledgments
This image is the copyrighted work of the attributed author or publisher, and ZFIN has permission only to display this image to its users. Additional permissions should be obtained from the applicable author or publisher of the image. Full text @ Int. J. Mol. Sci.