IMAGE

Figure 4

ID
ZDB-IMAGE-231225-117
Source
Figures for Zhai et al., 2023
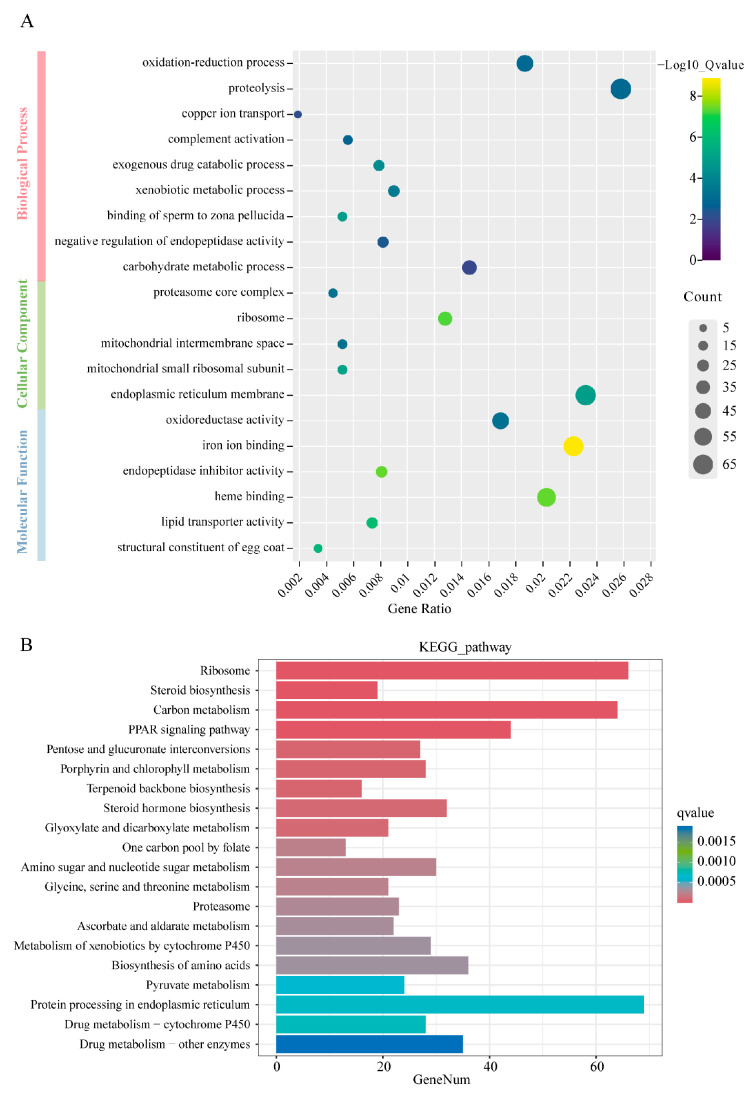
Image
Figure Caption

Figure 4

GO and KEGG pathway enrichment analysis of DEGs. (A) GO annotation analysis. Red: biological process; green: cellular component; blue: molecular function. The vertical axis represents the name of the GO term, the horizontal axis represents the gene ratio, the size of the dots indicates the number of differentially expressed genes in the term, and the color of the dots corresponds to different q-value ranges. (B) Top 20 pathways enriched in KEGG of DEGs. The vertical axis represents the name of the pathway, the horizontal axis represents the number of differentially expressed genes in the pathway, and the color corresponds to different q-value ranges.

Acknowledgments
This image is the copyrighted work of the attributed author or publisher, and ZFIN has permission only to display this image to its users. Additional permissions should be obtained from the applicable author or publisher of the image. Full text @ Int. J. Mol. Sci.