
- Title
-
Angpt2/Tie2 autostimulatory loop controls tumorigenesis
- Authors
- Karabid, N.M., Wiedemann, T., Gulde, S., Mohr, H., Segaran, R.C., Geppert, J., Rohm, M., Vitale, G., Gaudenzi, G., Dicitore, A., Ankerst, D.P., Chen, Y., Braren, R., Kaissis, G., Schilling, F., Schillmaier, M., Eisenhofer, G., Herzig, S., Roncaroli, F., Honegger, J.B., Pellegata, N.S.
- Source
- Full text @ EMBO Mol. Med.

ANGPT2 plasma concentration in 69 NF‐NF‐PitNET patients and in 69 age‐ and gender‐matched healthy controls. Each dot represents one individual. Healthy controls: mean ± SEM = 0.8698 ± 0.05757; PitNET patients; mean ± SEM = 1.786 ± 0.1383; Difference between means = 0.9158 ± 0.1498; 95% confidence interval = 0.6181 to 1.213. *** Correlation between circulating ANGP T2 levels and Ki67 LI (i.e., % of Ki67‐positive cells). All box plots show 25th to 75th percentiles (box) and 5th to 95th percentiles (whiskers). The line in the box represents the median. Results are expressed as mean ± SEM. ** Expression of ANGPT1 and ANGPT2 in human unaffected anterior pituitary (control, Summary of the IHC results for human NF‐PitNETs. Expression of Tie2 receptor in human normal pituitary ( |

Zebrafish larvae were implanted with red fluorescence‐stained GH3 cells infected with unspecific shRNA (shCtrl) or with sh Quantification of tumor‐induced vessel sprouting in zebrafish embryos engrafted with GH3 ‐shCtrl versus shC2 cells ( Example of flow cytometry data of primary rat pituitary cells from a tumor‐bearing MENX rat gated for cell surface Tie2 and CD31 expression (cells were pre‐gated for Tie2). Percentage of Tie2+CD31− (PitNET cells) and Tie2+CD31+ (ECs) in the pituitary glands of 7 age‐matched (8 months) MENX rats. Data are expressed as the mean ± SEM. **** A representative graph displaying the Tie2 fluorescence intensity and counts of Tie2+CD31− and Tie2+CD31− cell populations the pituitary of one rat. Fluorescence intensities of the Tie2+CD31− and Tie2+CD31− cell populations across all 7 pituitary samples. Data are expressed as the mean ± SEM. n.s, not significant (Mann–Whitney test). |
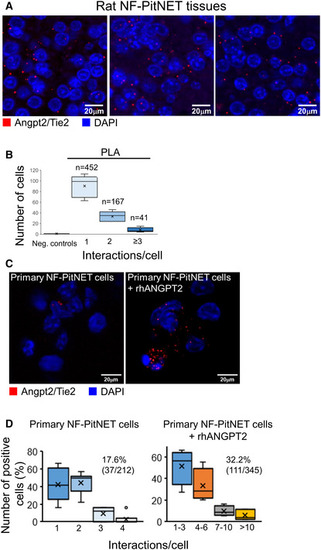
Proximity ligation assay (PLA) was performed on FFPE sections of rat PitNETs ( Quantification of the interactions between Angpt2 and Tie2 in rat PitNET tissues versus negative controls obtained using only 1 antibody (Appendix Fig PLA was performed as in (A) on isolated rat primary NF‐PitNET stimulated with rhANGPT2. Quantification of Angpt2/Tie2 interactions in primary NF‐PitNET incubated with/without rhANGPT2. The total number of cells counted is reported in parenthesis (i.e., 212 and 345) as well as the number of positive cells (= showing at least one interaction). The graphs show the percentage of cells having the number of interactions reported on the x axis. Box plots show 25th to 75th percentiles (box) and 5th to 95th percentiles (whiskers). The line in the box represents the median, the “x” represents the mean, and the circle outlier points. Data information: (C, D) Pictures were taken with the same exposure time. Results shown are representative of the stainings results across all samples ( |

Scheme of the wild‐type Tie2 receptor (left), and the receptor domain left‐over in the targeted clones #18 and #19 (right) and the impact of the mutation on the activation of downstream signaling. Expression of total Fak and P‐Fak (Y397) in serum‐starved GH3 Ctrl‐KO and Tie2‐KO clones #18 and #19 stimulated with rhANGPT2 for 30 min or left untreated. The numbers represent the ratio phospho/total Fak. Anti‐α‐tubulin antibody was used to check for equal loading. Blot shown is representative of 3 independent experiments. Scheme of the T2‐weighted images of two xenografted tumors taken at day 0 and 21 (largest diameter) representing the two animal groups. Scale bar: 2 mm, except GH3‐Ctrl KO day 21: 4 mm. Changes in tumor volumes as determined by MRI were normalized to the day 0 value (=100%) for each animal. All box plots show 25th to 75th percentiles (box) and 5th to 95th percentiles (whiskers). The line in the box represents the median. ** Expression of Tie2 (red) in the xenografted tumors ( |

Scheme of the T2‐weighted images of two xenografted tumors taken at day 0 and 21 (largest diameter). The tumors are representative of the two treatment groups Scale bar: 2 mm. Changes in tumor volumes as determined by MRI were normalized to the day 0 value (= 100%) for each animal. All box plots show 25th to 75th percentiles (box) and 5th to 95th percentiles (whiskers). The line in the box represents the median. ** Changes in tumor volumes in female rats treated with AMG386 ( ADC values of the rat PitNETs before (day 0) and after (day 14) treatment with AMG386 (red, Quantification of Annexin V intensity from tissues stained as in (F) ( |

Pituitary tumor cells secrete mostly Angpt2 in the TME. Tumor‐associated ECs secrete mostly Angpt2 but also Angpt1. Thanks to the expression of Tie2 on their plasma membrane, tumor cells can respond to angiopoietins (secreted by both tumor and endothelial cells) and activate pro‐proliferative/pro‐survival pathways. |

qRT–PCR for IHC was performed on pituitary tissues from wild‐type ( Expression of Angpt2, Tie2, and CD‐31 in rat NF‐PitNETs and associated ECs (used as positive control). Consecutive tissue sections of rat NF‐PitNETs ( |

Expression of Angpt2 and Tie2 was assessed in Att20, GH3, LβT2 and αT3 cells by western blotting (WB) using specific antibodies. α‐Tubulin was included as loading control. Immunofluorescence (IF) of GH3 cells for Angpt2 (red) and Tie2 (green). Nuclei were counterstained with DAPI (blue). Original magnification: 400x; scale bar: 20 µm. Panels shown are representative of 3 independent experiments. Cell proliferation of GH3 cells transfected with si In samples parallel to (C), activated caspase‐3/7 was measured to assess for apoptosis. *** Cell proliferation of GH3 cells transfected with the individual siAngpt2 or scrRNA and incubated with rhANGPT2 (+rhANGPT2) or left untreated (−rhANGPT2) normalized against scrRNA‐transfected, untreated (scr‐rhANGPT2) cells. n.s., not significant; *** In samples parallel to (E), activated caspase‐3/7 was measured to assess for apoptosis. n.s., not significant; *** Cell proliferation of GH3‐sh In samples parallel to (G), activated caspase‐3/7 was measured to assess for apoptosis. *** GH3 cells transfected with si Cell viability of isolated rat primary EC cells incubated with CM from isolated rat primary PitNET cells. The experiments was performed independently 2 times, each with 3 technical replicates. Results are expressed as mean ± SEM. * |

Co‐IF for both P‐Tie2 (Tyr 1102/1108; red) and for Na+K+ ATPase (green), used as plasma membrane marker, of GH3 cells transduced with unspecific shRNA (shCtrl) and sh Quantification of P‐Tie2 immunostaining intensity in cells shown in (A) shCtrl‐transduced GH3 cells (266.71 ± 12.12); in sh Tie2 and P‐Tie2 expression in serum‐starved GH3 cells transfected with siAngpt2 POOLs and stimulated with rhANGPT2 for the indicated times. Tie2 and P‐Tie2 expression in cells as in (C) stimulated with the indicated doses of rhANGPT2 for 30 min. Co‐IF for Angpt2 (red) and P‐Tie2 (green) of a representative rat primary NF‐PitNET. Nuclei were counterstained with DAPI. White arrows point to Angpt2‐positive (P‐Tie2 negative) cells in adjacent non‐tumor area. Scale bars: 50 µm. T, tumor area. Data information: (C, D) Blots shown in all panels are representative of three independent experiments. The numbers represent the ratio phospho/total proteins. |

Cell proliferation of GH3 cells treated with 5 μg/ml AMG386 (A) or 5 μM Tie2‐KI (B) or left untreated (ctrl) normalized against untreated cells. *** Cell viability of rat primary PitNET cells (R‐PitNET) treated with AMG386 ( Expression of phosphorylated (P) and total Akt, p38 and Erk1/2 in two R‐PitNET cultures with enough cells upon treatment with AMG386. Expression of phosphorylated (P) and total Akt in one R‐PitNET culture treated with Tie2‐KI or left untreated (ctrl). Cell viability of human primary PitNET cultures treated with (G, H) AMG386 ( Example of responsive H‐PitNET treated with AMG386 or Tie2‐KI. Total proteins were extracted and probed for P‐ and total Akt and Erk1/2. Anti‐α‐tubulin antibody as used to check for equal loading. The blot shown is representative of three independent cultures. Data information: (E, F) Blots shown are representative of 3 independent experiments. (E, F, K) The numbers below the bands represent the ratio phospho/total proteins. |