IMAGE

Figure EV2

ID
ZDB-IMAGE-220516-4
Source
Figures for Karabid et al., 2022
Image
Figure Caption

Figure EV2 PitNET cells express Angpt2 and Tie2, and intrinsic Angpt2 promotes PitNET cell survival <italic toggle='yes'>in vitro</italic>

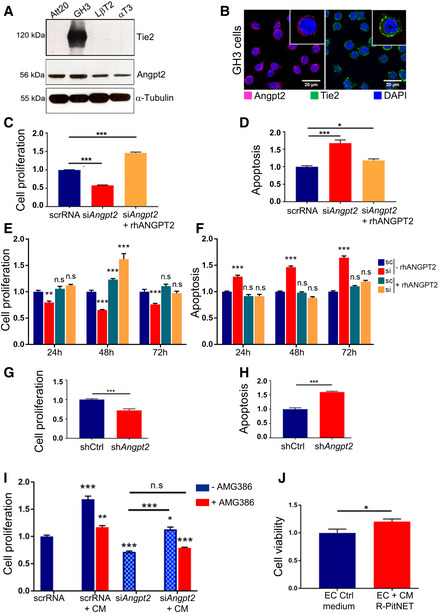
Expression of Angpt2 and Tie2 was assessed in Att20, GH3, LβT2 and αT3 cells by western blotting (WB) using specific antibodies. α‐Tubulin was included as loading control.

Immunofluorescence (IF) of GH3 cells for Angpt2 (red) and Tie2 (green). Nuclei were counterstained with DAPI (blue). Original magnification: 400x; scale bar: 20 µm. Panels shown are representative of 3 independent experiments.

Cell proliferation of GH3 cells transfected with siAngpt2 or scrRNA POOLs and incubated with rhANGPT2 (+rhANGPT2) or left untreated (−rhANGPT2) normalized against scrRNA‐transfected cells. ***P < 0.0001 (one‐way ANOVA).

In samples parallel to (C), activated caspase‐3/7 was measured to assess for apoptosis. ***P < 0.0001; *P = 0.0411 (one‐way ANOVA).

Cell proliferation of GH3 cells transfected with the individual siAngpt2 or scrRNA and incubated with rhANGPT2 (+rhANGPT2) or left untreated (−rhANGPT2) normalized against scrRNA‐transfected, untreated (scr‐rhANGPT2) cells. n.s., not significant; ***P < 0.0001; **P < 0.002 (one‐way ANOVA).

In samples parallel to (E), activated caspase‐3/7 was measured to assess for apoptosis. n.s., not significant; ***P < 0.0001 (one‐way ANOVA).

Cell proliferation of GH3‐shAngpt2 (#2) cells or cells transduced with shCtrl was measured 24h later and normalized against shCtrl. ***P < 0.0001 (t‐test).

In samples parallel to (G), activated caspase‐3/7 was measured to assess for apoptosis. ***P < 0.0001 (t‐test).

GH3 cells transfected with siAngpt2 or scrRNA POOLs were incubated with conditioned medium (CM) from rat primary PitNET cells for 24 h. CM was pre‐incubated with AMG386 (red bars), or left untreated (blue bars). Cell proliferation was measured and normalized against that of scrRNA‐transfected cells. n.s., not significant; ***P < 0.0001; **P = 0.00116; *P = 0.0192 by two‐way ANOVA.

Cell viability of isolated rat primary EC cells incubated with CM from isolated rat primary PitNET cells. The experiments was performed independently 2 times, each with 3 technical replicates. Results are expressed as mean ± SEM. *P < 0.0368 (t‐test). (C–I) Data are expressed as the mean ± SEM of three biological replicates, each with 3–6 technical replicates.

Source data are available online for this figure.

Acknowledgments
This image is the copyrighted work of the attributed author or publisher, and ZFIN has permission only to display this image to its users. Additional permissions should be obtained from the applicable author or publisher of the image. Full text @ EMBO Mol. Med.