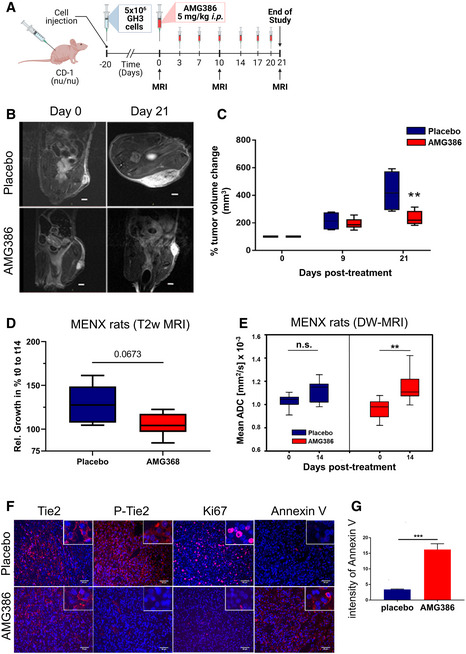
IMAGE

Figure 5

ID
ZDB-IMAGE-220516-10
Source
Figures for Karabid et al., 2022
Image
Figure Caption

Figure 5 Pharmacological inhibition of Ang/Tie2 signaling suppresses growth and induces apoptosis of PitNET cells xenograft models and of autochthonous PitNETs in MENX rats <italic toggle='yes'>in vivo</italic>

Scheme of the in vivo treatment of GH3‐derived xenografts with AMG386.

T2‐weighted images of two xenografted tumors taken at day 0 and 21 (largest diameter). The tumors are representative of the two treatment groups Scale bar: 2 mm.

Changes in tumor volumes as determined by MRI were normalized to the day 0 value (= 100%) for each animal. All box plots show 25th to 75th percentiles (box) and 5th to 95th percentiles (whiskers). The line in the box represents the median. **P = 0.007 (one way ANOVA).

Changes in tumor volumes in female rats treated with AMG386 (n = 6) or with placebo (n = 5) for 14 days as determined by anatomical MRI, normalized to the day 0 value. Box plots show 25th to 75th percentiles (box) and 5th to 95th percentiles (whiskers). The line in the box represents the median. P = 0.0673, not significant (one way ANOVA).

ADC values of the rat PitNETs before (day 0) and after (day 14) treatment with AMG386 (red, n = 8) or placebo (blue, n = 5). Box plots show 25th to 75th percentiles (box) and 5th to 95th percentiles (whiskers). The line in the box represents the median. **P = 0.009; n.s., not significant (t‐test).

Ex vivo expression of Tie2, P‐Tie2, Ki67 and Annexin V in PitNETs of female rats treated with AMG386 or placebo for 14 days. Original magnification: 200×; scale bar: 50 µm. Panels shown are representative of the two animal groups.

Quantification of Annexin V intensity from tissues stained as in (F) (n = 4/group). Three different areas per tumor sample were analyzed. Intensities are expressed as arbitrary units ± SEM. ***P < 0.001 (by t‐test).

Source data are available online for this figure.

Acknowledgments
This image is the copyrighted work of the attributed author or publisher, and ZFIN has permission only to display this image to its users. Additional permissions should be obtained from the applicable author or publisher of the image. Full text @ EMBO Mol. Med.