
|
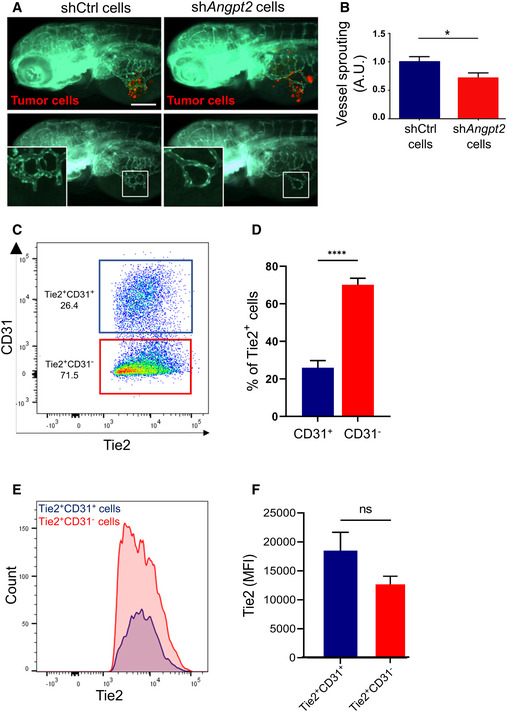
Figure 2
Zebrafish larvae were implanted with red fluorescence‐stained GH3 cells infected with unspecific shRNA (shCtrl) or with sh Quantification of tumor‐induced vessel sprouting in zebrafish embryos engrafted with GH3 ‐shCtrl versus shC2 cells ( Example of flow cytometry data of primary rat pituitary cells from a tumor‐bearing MENX rat gated for cell surface Tie2 and CD31 expression (cells were pre‐gated for Tie2). Percentage of Tie2+CD31− (PitNET cells) and Tie2+CD31+ (ECs) in the pituitary glands of 7 age‐matched (8 months) MENX rats. Data are expressed as the mean ± SEM. **** A representative graph displaying the Tie2 fluorescence intensity and counts of Tie2+CD31− and Tie2+CD31− cell populations the pituitary of one rat. Fluorescence intensities of the Tie2+CD31− and Tie2+CD31− cell populations across all 7 pituitary samples. Data are expressed as the mean ± SEM. n.s, not significant (Mann–Whitney test).