
|
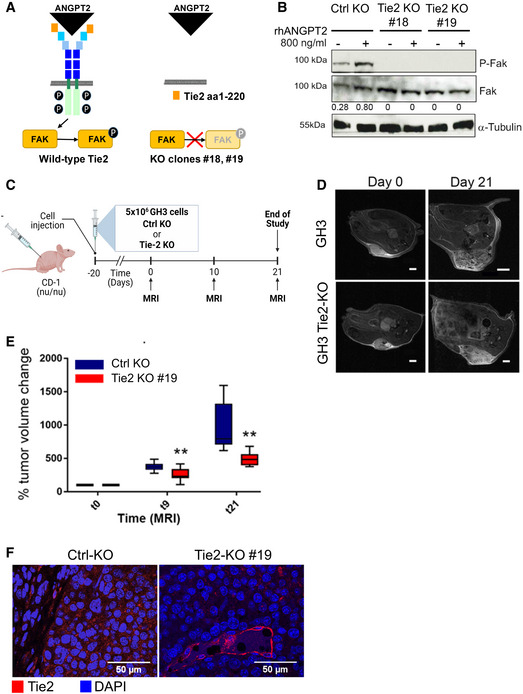
Figure 4
Scheme of the wild‐type Tie2 receptor (left), and the receptor domain left‐over in the targeted clones #18 and #19 (right) and the impact of the mutation on the activation of downstream signaling. Expression of total Fak and P‐Fak (Y397) in serum‐starved GH3 Ctrl‐KO and Tie2‐KO clones #18 and #19 stimulated with rhANGPT2 for 30 min or left untreated. The numbers represent the ratio phospho/total Fak. Anti‐α‐tubulin antibody was used to check for equal loading. Blot shown is representative of 3 independent experiments. Scheme of the T2‐weighted images of two xenografted tumors taken at day 0 and 21 (largest diameter) representing the two animal groups. Scale bar: 2 mm, except GH3‐Ctrl KO day 21: 4 mm. Changes in tumor volumes as determined by MRI were normalized to the day 0 value (=100%) for each animal. All box plots show 25th to 75th percentiles (box) and 5th to 95th percentiles (whiskers). The line in the box represents the median. ** Expression of Tie2 (red) in the xenografted tumors (