
|
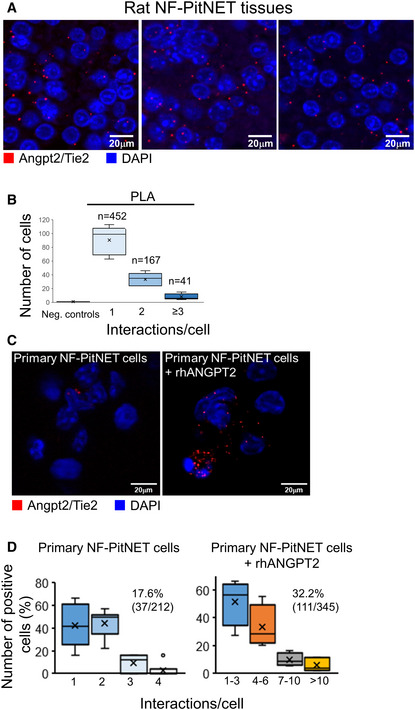
Figure 3
Proximity ligation assay (PLA) was performed on FFPE sections of rat PitNETs ( Quantification of the interactions between Angpt2 and Tie2 in rat PitNET tissues versus negative controls obtained using only 1 antibody (Appendix Fig PLA was performed as in (A) on isolated rat primary NF‐PitNET stimulated with rhANGPT2. Quantification of Angpt2/Tie2 interactions in primary NF‐PitNET incubated with/without rhANGPT2. The total number of cells counted is reported in parenthesis (i.e., 212 and 345) as well as the number of positive cells (= showing at least one interaction). The graphs show the percentage of cells having the number of interactions reported on the x axis. Box plots show 25th to 75th percentiles (box) and 5th to 95th percentiles (whiskers). The line in the box represents the median, the “x” represents the mean, and the circle outlier points.
Data information: (C, D) Pictures were taken with the same exposure time. Results shown are representative of the stainings results across all samples (