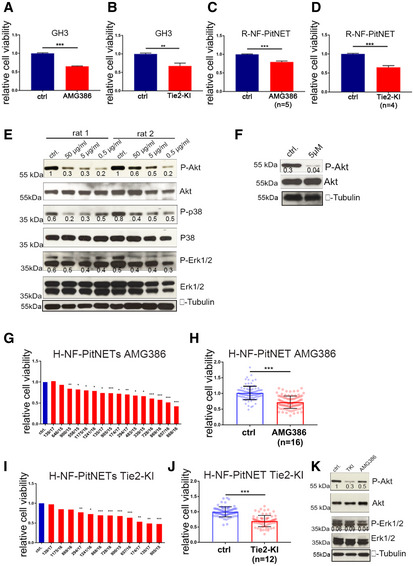
IMAGE

Figure EV4

ID
ZDB-IMAGE-220516-9
Source
Figures for Karabid et al., 2022
Image
Figure Caption

Figure EV4 Pharmacological Ang/Tie2 pathway inhibition reduces the viability of PitNET cell lines, and of rat/human primary cultures <italic toggle='yes'>in vitro</italic>

Cell proliferation of GH3 cells treated with 5 μg/ml AMG386 (A) or 5 μM Tie2‐KI (B) or left untreated (ctrl) normalized against untreated cells. ***P < 0.0001; **P = 0.0072 (t‐test). Results are expressed as mean ± SEM of three biological replicates with 6 technical replicates.

Cell viability of rat primary PitNET cells (R‐PitNET) treated with AMG386 (n = 5 rats) (C) or Tie2‐KI (n = 4 rats) (D) or left untreated (ctrl) normalized against untreated cells. Primary cultures were treated, each with 6 technical replicates. Results are expressed as mean ± SD. ***P < 0.0001 (t‐test).

Expression of phosphorylated (P) and total Akt, p38 and Erk1/2 in two R‐PitNET cultures with enough cells upon treatment with AMG386.

Expression of phosphorylated (P) and total Akt in one R‐PitNET culture treated with Tie2‐KI or left untreated (ctrl).

Cell viability of human primary PitNET cultures treated with (G, H) AMG386 (n = 16) or (I, J) Tie2‐KI (n = 12) normalized against untreated control cells for each patient (set to 1). Significance in (G, I): *P < 0.05; **P < 0.01; ***P < 0.001 (by t‐test, comparing each treated sample with its untreated control). Results in (H) and (J) are expressed as mean ± SEM of the normalized values of 6 technical replicates for each samples. Each dot represents the relative cell viability of one technical replicate. Significance in (H, J) ***P < 0.0001 (t‐test).

Example of responsive H‐PitNET treated with AMG386 or Tie2‐KI. Total proteins were extracted and probed for P‐ and total Akt and Erk1/2. Anti‐α‐tubulin antibody as used to check for equal loading. The blot shown is representative of three independent cultures.

Data information: (E, F) Blots shown are representative of 3 independent experiments. (E, F, K) The numbers below the bands represent the ratio phospho/total proteins.

Source data are available online for this figure.

Acknowledgments
This image is the copyrighted work of the attributed author or publisher, and ZFIN has permission only to display this image to its users. Additional permissions should be obtained from the applicable author or publisher of the image. Full text @ EMBO Mol. Med.