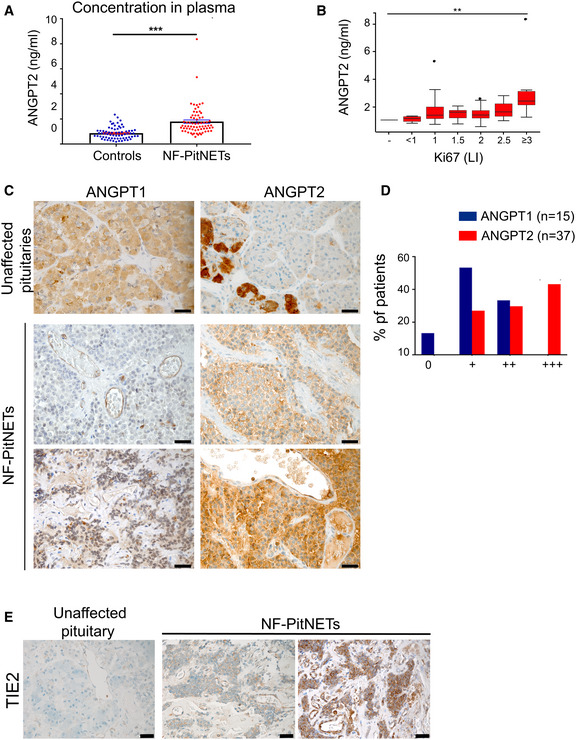
IMAGE

Figure 1

ID
ZDB-IMAGE-220516-2
Source
Figures for Karabid et al., 2022
Image
Figure Caption

Figure 1 ANGPT2 is elevated in NF‐PitNET patients’ plasma, and is expressed in human primary NF‐PitNETs together with Tie2 and ANGPT1

ANGPT2 plasma concentration in 69 NF‐NF‐PitNET patients and in 69 age‐ and gender‐matched healthy controls. Each dot represents one individual. Healthy controls: mean ± SEM = 0.8698 ± 0.05757; PitNET patients; mean ± SEM = 1.786 ± 0.1383; Difference between means = 0.9158 ± 0.1498; 95% confidence interval = 0.6181 to 1.213. ***P‐value < 0.0001 by unpaired t‐test with Welch’s correction.

Correlation between circulating ANGP T2 levels and Ki67 LI (i.e., % of Ki67‐positive cells). All box plots show 25th to 75th percentiles (box) and 5th to 95th percentiles (whiskers). The line in the box represents the median. Results are expressed as mean ± SEM. **P = 0.014 by one‐way ANOVA (P = 0.007 by Kruskal–Wallis test).

Expression of ANGPT1 and ANGPT2 in human unaffected anterior pituitary (control, n = 3) and in human NF‐PitNETs. Thirty‐seven human NF‐PitNETs were analyzed for ANGPT2 expression and 14 for ANGPT1. NF‐PitNET panels show representative cases. Original magnification: 400×; scale bar: 20 µm.

Summary of the IHC results for human NF‐PitNETs.

Expression of Tie2 receptor in human normal pituitary (n = 3) and human NF‐PitNET tissues (n = 10). Original magnification: 400×; scale bar: 20 µm.

Acknowledgments
This image is the copyrighted work of the attributed author or publisher, and ZFIN has permission only to display this image to its users. Additional permissions should be obtained from the applicable author or publisher of the image. Full text @ EMBO Mol. Med.