
- Title
-
The EMT transcription factor Snai1 maintains myocardial wall integrity by repressing intermediate filament gene expression
- Authors
- Gentile, A., Bensimon-Brito, A., Priya, R., Maischein, H.M., Piesker, J., Guenther, S., Gunawan, F., Stainier, D.Y.
- Source
- Full text @ Elife

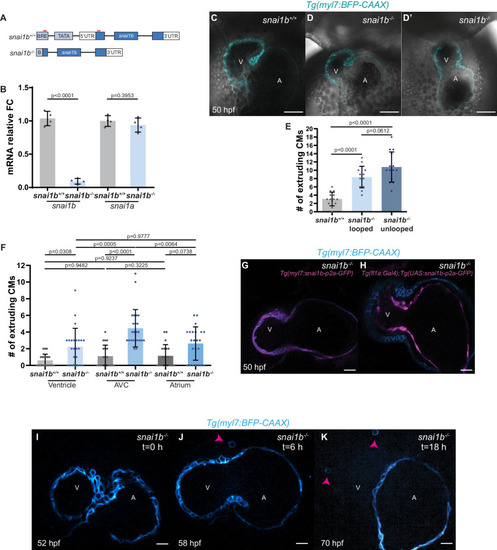
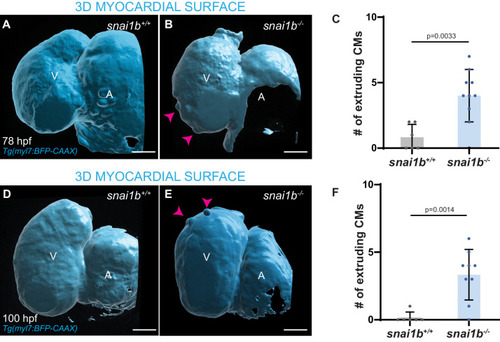
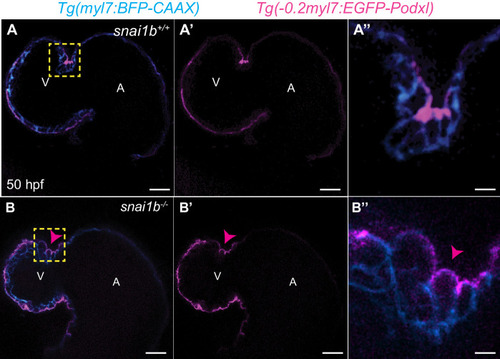
(A–B”) Single-plane images of Tg(myl7:BFP-CAAX) snai1b+/+ (A) and snai1b-/- (B) hearts at 50 hpf. Close-up of boxed areas (A’, B’) and schematic (A”, B”). (C–D’) 3D surface rendering of the myocardium of Tg(myl7:BFP-CAAX) snai1b+/+ (C, C’) and snai1b-/- (D, D’) embryos at 50 hpf. CM extrusions are clearly observed in snai1b-/- embryos (magenta arrowheads in B, B’, B”, D, D’). (E) More CMs are extruding in Tg(myl7:BFP-CAAX) snai1b-/- embryos compared with snai1b+/+ and snai1b+/- siblings at 50 hpf (snai1b+/+, n = 20; snai1b+/-, n = 23; snai1b-/-, n = 24). (F–H) Blocking cardiac contractions with tnnt2a MO leads to a reduced number of extruding CMs in snai1b-/- embryos, comparable with uninjected snai1b+/+ embryos. (F–G’) 3D surface rendering of the myocardium of snai1b+/+ (F) and snai1b-/- (G) uninjected embryos and snai1b-/- embryos injected with tnnt2a MO (G’). (H) Fewer CMs are extruding (magenta arrowheads in G) in snai1b-/- embryos injected with tnnt2a MO (n = 14) compared with uninjected snai1b-/- (n = 6) and snai1b+/+ (n = 9) embryos at 50 hpf. (I–L) 3D surface rendering of the myocardium showing snai1b+/+ donor-derived CMs in a snai1b+/+ (I) or snai1b-/- (J) heart, and snai1b-/- donor-derived CMs in a snai1b+/+ heart (K). (L) The percentage of donor-derived CMs that extrude is higher when snai1b-/- donor-derived CMs are in snai1b+/+ hearts (n = 8) than when snai1b+/+ donor-derived CMs are in snai1b+/+ (n = 5) or snai1b-/- (n = 14) hearts. (M–P) Overexpression of snai1b specifically in CMs partially rescues the CM extrusion phenotype in snai1b-/- embryos. 3D surface rendering of the myocardium of a snai1b-/- embryo (M), and snai1b-/- embryo overexpressing snai1b under a myl7 (N) or a fli1a (O) promoter. (P) Fewer CMs are extruding (magenta arrowheads) in snai1b-/- embryos (n = 19) overexpressing snai1b in CMs (N, P) compared with snai1b-/- embryos (M, P, n = 38), and this number is comparable to that in snai1+/+ embryos (n = 24). The number of extruding CMs does not change in snai1b-/- embryos (n = 16) when snai1b is overexpressed in endothelial cells (fli1a) (O, P). Plot values represent means ± S.D.; p-values determined by one-way ANOVA followed by multiple comparisons with Dunn test (E, H, L, P). Scale bars: 20 µm. V: ventricle; A: atrium; ap: apical; ba: basal; n: number of embryos. |
( |
( |
( |
( |
( EXPRESSION / LABELING:
PHENOTYPE:
|
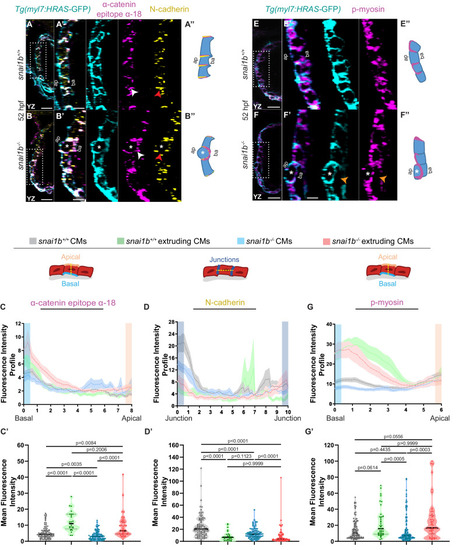
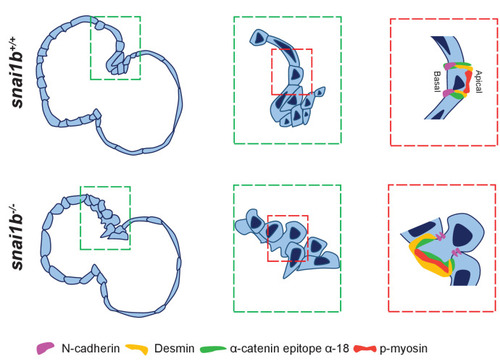
(A–B”) Orthogonal projections in the YZ plane of a 52 hpf snai1b+/+ heart (A) immunostained for α-catenin epitope α-18, N-cadherin, and GFP compared with a snai1b-/- sibling heart (B). Close-up of boxed areas of snai1b+/+ (A’) and snai1b-/- (B’) CMs. Schematics illustrate the localization of activated α-catenin (magenta) in the basal domain of extruding CMs in snai1b-/- embryos and defects in N-cadherin (yellow) localization in the junctional domain of snai1b-/- CMs (A”–B”). (C–D’) Fluorescence intensity profile (FIP) (C–D) and mean fluorescence intensity (mFI) (C’–D’) of α-catenin epitope α-18 and N-cadherin immunostaining in 52 hpf snai1b+/+ and snai1b-/- CMs, and in snai1b+/+ and snai1b-/- extruding CMs. The α-catenin epitope α-18 is observed in the basal domain (white arrowhead in B’) of extruding CMs (white asterisks in B’) in snai1b-/- embryos, and a reduction in junctional N-cadherin (red arrowhead in B’) is observed in snai1b-/- CMs. (FIP α-catenin epitope α-18: snai1b+/+ CMs, N = 179; snai1b+/+ extruding CMs, N = 60; snai1b-/- CMs, N = 140; snai1b-/- extruding CMs, N = 54; mFI α-catenin epitope α-18: snai1b+/+ CMs, N = 90; snai1b+/+ extruding CMs, N = 24; snai1b-/- CMs, N = 88; snai1b-/- extruding CMs, N = 44. FIP N-cadherin: snai1b+/+ CMs, N = 90; snai1b+/+ extruding CMs, N = 12; snai1b-/- CMs, N = 98; snai1b-/- extruding CMs, N = 49; mFI N-cadherin: snai1b+/+ CMs, N = 90; snai1b+/+ extruding CMs, N = 25; snai1b-/- CMs, N = 92; snai1b-/- extruding CMs, N = 70.) (E–F”) Representative images of a 52 hpf snai1b-/- heart (F) immunostained for p-myosin and GFP compared with a snai1b+/+ sibling heart (E). Schematics illustrate the basal enrichment of p-myosin (magenta) in extruding CMs in snai1b-/- embryos (E”–F”). (G–G’) FIP (G) and mFI (G’) of p-myosin immunostaining in snai1b+/+ and snai1b-/- CMs, and in snai1b+/+ and snai1b-/- extruding CMs. p-myosin is enriched basally (orange arrowheads in F’) in snai1b-/- extruding CMs in (white asterisks in F’). (FIP p-myosin: snai1b+/+ CMs, N = 204; snai1b+/+ extruding CMs, N = 60; snai1b-/- CMs, N = 140; snai1b-/- extruding CMs, N = 49; mFI p-myosin: snai1b+/+ CMs, N = 100; snai1b+/+ extruding CMs, N = 29; snai1b-/- CMs, N = 153; snai1b-/- extruding CMs, N = 48). Plot values represent means ± S.E.M. (C, D, G). In the violin plots (C’, D’, G’), solid black lines indicate median. p-values determined by Kruskal–Wallis test (C’, D’, G’). Scale bars: 20 µm (A, B, E, F); 2 µm (A’, B’, E’, F’). ap: apical; ba: basal; N: number of CMs. See also Figure 2—figure supplement 1. |
( |
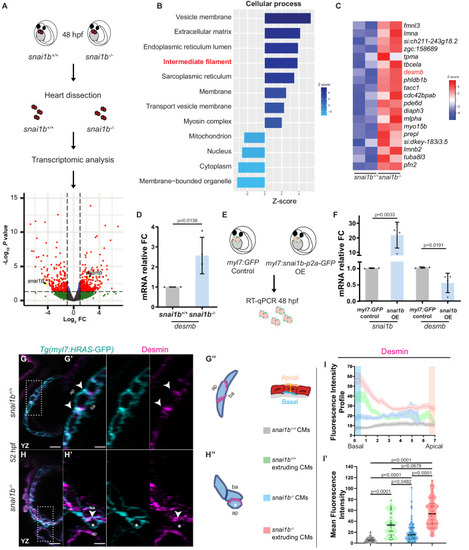
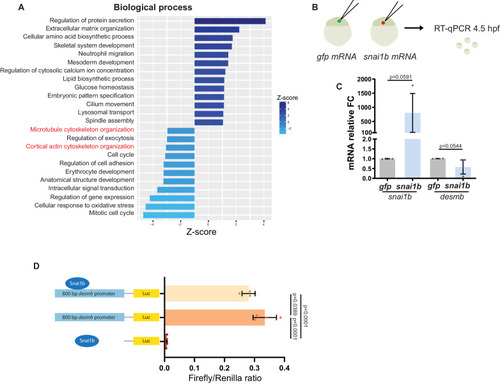
(A) RNA extracted from 48 hpf snai1b+/+ and snai1b-/- hearts was used for transcriptomic analysis. (B) GO analysis of cellular processes shows enrichment of intermediate filament components in snai1b-/- hearts. (C) Heatmap of a list of upregulated cytoskeletal genes, including desmb. (D) Relative mRNA levels of desmb are significantly increased in snai1b-/- hearts at 48 hpf; n = 4 biological replicates, 30 hearts each. (E) Schematic of snai1b overexpression under a myl7 promoter; snai1b and desmb mRNA levels analysed at 48 hpf. (F) Relative mRNA levels of desmb are significantly reduced in snai1b cardiomyocyte (CM)-specific overexpressing hearts at 48 hpf; n = 4 biological replicates, 30 hearts each. (G–H”) Orthogonal projections in the YZ plane of a 52 hpf snai1b-/- heart (H) immunostained for Desmin and membrane GFP compared with a snai1b+/+ heart (G). Close-up of boxed areas of snai1b+/+ (G’) and snai1b-/- (H’) CMs. Schematics (Desmin in magenta) illustrate the basal enrichment of Desmin in extruding CMs in snai1b-/- embryos (G”–H”). (I–I’) Fluorescence intensity profile (FIP) (I) and mean fluorescence intensity (mFI) (I’) of Desmin in snai1b+/+ and snai1b-/- CMs, and in snai1b+/+ and snai1b-/- extruding CMs. Desmin immunostaining is observed throughout the snai1b-/- myocardium, with an enrichment in the basal domain (white arrowheads in H’–G’) in extruding CMs (white asterisks in H’). (FIP: snai1b+/+ CMs, N = 49; snai1b+/+ extruding CMs, N = 41; snai1b-/- CMs, N = 45; snai1b-/- extruding CMs, N = 41; mFI: snai1b+/+ CMs, N = 56; snai1b+/+ extruding CMs, N = 30; snai1b-/- CMs, N = 65; snai1b-/- extruding CMs, N = 46). Plot values represent means ± S.D. (D, F) or mean ± S.E.M. (I). In the violin plot (I’), solid black lines indicate median. p-Values determined by Student’s t-test (D, F) or Kruskal–Wallis test (I’). Scale bars: 20 µm (G, H); 2 µm (G’, H’). ap: apical; ba: basal; n: number of embryos; N: number of CMs; FC: fold change. All Ct values are listed in Supplementary file 2. See also Figure 3—figure supplement 1. |
( |
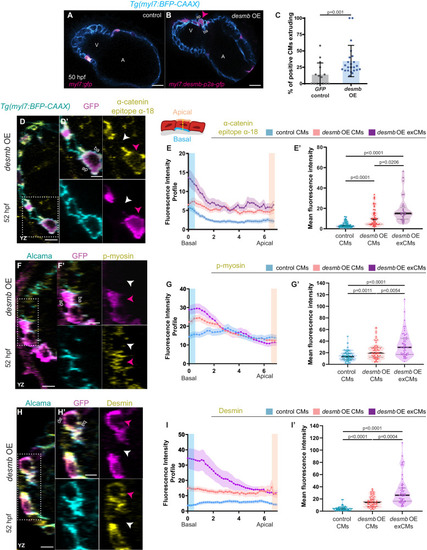
(A, B) Single-plane images of snai1b+/+ embryos injected with myl7:GFP (A) or with myl7:desmb-p2a-GFP (B) at 50 hpf. (C) A higher percentage of CMs extrude when overexpressing desmb (n = 23) compared with control (n = 15) (magenta arrowheads in B, B’). (D–D’, F–F’, H–H’) Orthogonal projections in the YZ plane of hearts from 52 hpf embryos injected with myl7:desmb-p2a-GFP and immunostained for α-catenin epitope α-18, GFP, and BFP (D–D’), p-myosin, GFP, and Alcama (F–F’), or Desmin, GFP, and Alcama (H–H’). Close-up of boxed areas of desmb-overexpressing and adjacent wild-type CMs (D’, F’, H’). (E–E’, G–G’, I–I’) Fluorescence intensity profile (FIP) (E, G, I) and mean fluorescence intensity (mFI) (E’, G’, I’) of α-catenin epitope α-18 (E–E’), p-myosin (G–G’), and Desmin (I–I’) in CMs that overexpress desmb (magenta arrowheads) and CMs that do not overexpress desmb (white arrowheads). α-catenin epitope α-18, p-myosin, and Desmin immunostaining signals are enriched in the basal domain in desmb overexpressing CMs. FIP: desmb OE CMs, (E) N = 132, (G) N = 120, (I) N = 88; desmb OE extruding CMs, (E) N = 47, (G) N = 54, (I) N = 49; control CMs, (E) N = 153, (G) N = 133, (I) N = 86. mFI: desmb OE CMs, (E’) N = 49, (G’) N = 65, (I’) N = 63; desmb OE extruding CMs, (E’) N = 33, (G’) N = 60, (I’) N = 59; control CMs, (E’) N = 55, (G’) N = 62, (I’) N = 64. Plot values represent means ± S.D. (C) or means ± S.E.M. (E, G, I). In the violin plots (E’, G’, I’), solid black lines indicate median. p-values determined by Mann–Whitney U (C) or Kruskal–Wallis (E’, G’, I’) test. Scale bars: 20 µm (A–B’, D, F, H); 2 µm (D’, F’, H’). V: ventricle; A: atrium; ap: apical; ba: basal; n: number of embryos; N: number of CMs. See also Figure 4—figure supplements 1–3. |
( PHENOTYPE:
|

( |
Loss of |