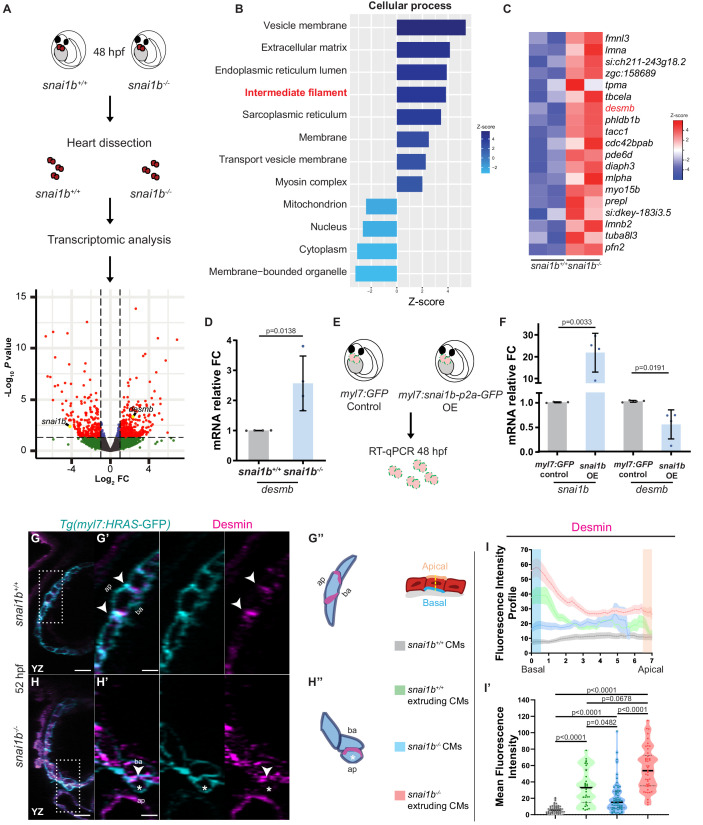
Figure 3 (A) RNA extracted from 48 hpf snai1b+/+ and snai1b-/- hearts was used for transcriptomic analysis. (B) GO analysis of cellular processes shows enrichment of intermediate filament components in snai1b-/- hearts. (C) Heatmap of a list of upregulated cytoskeletal genes, including desmb. (D) Relative mRNA levels of desmb are significantly increased in snai1b-/- hearts at 48 hpf; n = 4 biological replicates, 30 hearts each. (E) Schematic of snai1b overexpression under a myl7 promoter; snai1b and desmb mRNA levels analysed at 48 hpf. (F) Relative mRNA levels of desmb are significantly reduced in snai1b cardiomyocyte (CM)-specific overexpressing hearts at 48 hpf; n = 4 biological replicates, 30 hearts each. (G–H”) Orthogonal projections in the YZ plane of a 52 hpf snai1b-/- heart (H) immunostained for Desmin and membrane GFP compared with a snai1b+/+ heart (G). Close-up of boxed areas of snai1b+/+ (G’) and snai1b-/- (H’) CMs. Schematics (Desmin in magenta) illustrate the basal enrichment of Desmin in extruding CMs in snai1b-/- embryos (G”–H”). (I–I’) Fluorescence intensity profile (FIP) (I) and mean fluorescence intensity (mFI) (I’) of Desmin in snai1b+/+ and snai1b-/- CMs, and in snai1b+/+ and snai1b-/- extruding CMs. Desmin immunostaining is observed throughout the snai1b-/- myocardium, with an enrichment in the basal domain (white arrowheads in H’–G’) in extruding CMs (white asterisks in H’). (FIP: snai1b+/+ CMs, N = 49; snai1b+/+ extruding CMs, N = 41; snai1b-/- CMs, N = 45; snai1b-/- extruding CMs, N = 41; mFI: snai1b+/+ CMs, N = 56; snai1b+/+ extruding CMs, N = 30; snai1b-/- CMs, N = 65; snai1b-/- extruding CMs, N = 46). Plot values represent means ± S.D. (D, F) or mean ± S.E.M. (I). In the violin plot (I’), solid black lines indicate median. p-Values determined by Student’s t-test (D, F) or Kruskal–Wallis test (I’). Scale bars: 20 µm (G, H); 2 µm (G’, H’). ap: apical; ba: basal; n: number of embryos; N: number of CMs; FC: fold change. All Ct values are listed in Supplementary file 2. See also Figure 3—figure supplement 1.
Image
Figure Caption
Figure Data
Acknowledgments
This image is the copyrighted work of the attributed author or publisher, and
ZFIN has permission only to display this image to its users.
Additional permissions should be obtained from the applicable author or publisher of the image.
Full text @ Elife

