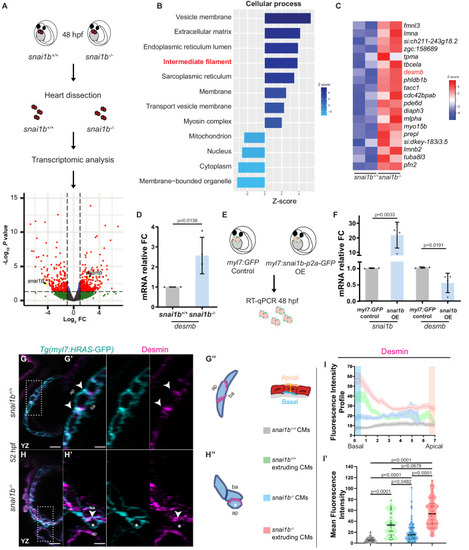
(A) RNA extracted from 48 hpf snai1b+/+ and snai1b-/- hearts was used for transcriptomic analysis. (B) GO analysis of cellular processes shows enrichment of intermediate filament components in snai1b-/- hearts. (C) Heatmap of a list of upregulated cytoskeletal genes, including desmb. (D) Relative mRNA levels of desmb are significantly increased in snai1b-/- hearts at 48 hpf; n = 4 biological replicates, 30 hearts each. (E) Schematic of snai1b overexpression under a myl7 promoter; snai1b and desmb mRNA levels analysed at 48 hpf. (F) Relative mRNA levels of desmb are significantly reduced in snai1b cardiomyocyte (CM)-specific overexpressing hearts at 48 hpf; n = 4 biological replicates, 30 hearts each. (G–H”) Orthogonal projections in the YZ plane of a 52 hpf snai1b-/- heart (H) immunostained for Desmin and membrane GFP compared with a snai1b+/+ heart (G). Close-up of boxed areas of snai1b+/+ (G’) and snai1b-/- (H’) CMs. Schematics (Desmin in magenta) illustrate the basal enrichment of Desmin in extruding CMs in snai1b-/- embryos (G”–H”). (I–I’) Fluorescence intensity profile (FIP) (I) and mean fluorescence intensity (mFI) (I’) of Desmin in snai1b+/+ and snai1b-/- CMs, and in snai1b+/+ and snai1b-/- extruding CMs. Desmin immunostaining is observed throughout the snai1b-/- myocardium, with an enrichment in the basal domain (white arrowheads in H’–G’) in extruding CMs (white asterisks in H’). (FIP: snai1b+/+ CMs, N = 49; snai1b+/+ extruding CMs, N = 41; snai1b-/- CMs, N = 45; snai1b-/- extruding CMs, N = 41; mFI: snai1b+/+ CMs, N = 56; snai1b+/+ extruding CMs, N = 30; snai1b-/- CMs, N = 65; snai1b-/- extruding CMs, N = 46). Plot values represent means ± S.D. (D, F) or mean ± S.E.M. (I). In the violin plot (I’), solid black lines indicate median. p-Values determined by Student’s t-test (D, F) or Kruskal–Wallis test (I’). Scale bars: 20 µm (G, H); 2 µm (G’, H’). ap: apical; ba: basal; n: number of embryos; N: number of CMs; FC: fold change. All Ct values are listed in Supplementary file 2. See also Figure 3—figure supplement 1.
|
