
Figure 4
- ID
- ZDB-FIG-210625-23
- Publication
- Gentile et al., 2021 - The EMT transcription factor Snai1 maintains myocardial wall integrity by repressing intermediate filament gene expression
- Other Figures
- All Figure Page
- Back to All Figure Page
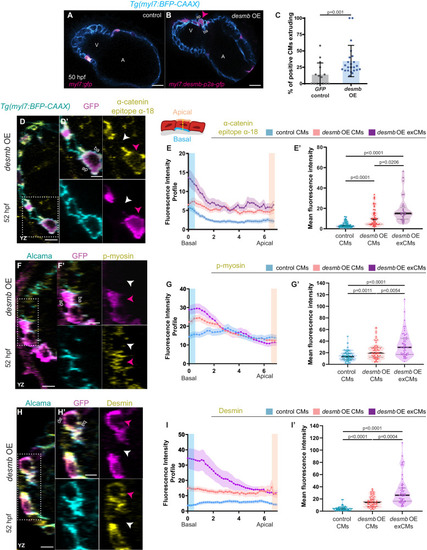
(A, B) Single-plane images of snai1b+/+ embryos injected with myl7:GFP (A) or with myl7:desmb-p2a-GFP (B) at 50 hpf. (C) A higher percentage of CMs extrude when overexpressing desmb (n = 23) compared with control (n = 15) (magenta arrowheads in B, B’). (D–D’, F–F’, H–H’) Orthogonal projections in the YZ plane of hearts from 52 hpf embryos injected with myl7:desmb-p2a-GFP and immunostained for α-catenin epitope α-18, GFP, and BFP (D–D’), p-myosin, GFP, and Alcama (F–F’), or Desmin, GFP, and Alcama (H–H’). Close-up of boxed areas of desmb-overexpressing and adjacent wild-type CMs (D’, F’, H’). (E–E’, G–G’, I–I’) Fluorescence intensity profile (FIP) (E, G, I) and mean fluorescence intensity (mFI) (E’, G’, I’) of α-catenin epitope α-18 (E–E’), p-myosin (G–G’), and Desmin (I–I’) in CMs that overexpress desmb (magenta arrowheads) and CMs that do not overexpress desmb (white arrowheads). α-catenin epitope α-18, p-myosin, and Desmin immunostaining signals are enriched in the basal domain in desmb overexpressing CMs. FIP: desmb OE CMs, (E) N = 132, (G) N = 120, (I) N = 88; desmb OE extruding CMs, (E) N = 47, (G) N = 54, (I) N = 49; control CMs, (E) N = 153, (G) N = 133, (I) N = 86. mFI: desmb OE CMs, (E’) N = 49, (G’) N = 65, (I’) N = 63; desmb OE extruding CMs, (E’) N = 33, (G’) N = 60, (I’) N = 59; control CMs, (E’) N = 55, (G’) N = 62, (I’) N = 64. Plot values represent means ± S.D. (C) or means ± S.E.M. (E, G, I). In the violin plots (E’, G’, I’), solid black lines indicate median. p-values determined by Mann–Whitney U (C) or Kruskal–Wallis (E’, G’, I’) test. Scale bars: 20 µm (A–B’, D, F, H); 2 µm (D’, F’, H’). V: ventricle; A: atrium; ap: apical; ba: basal; n: number of embryos; N: number of CMs. See also Figure 4—figure supplements 1–3. |