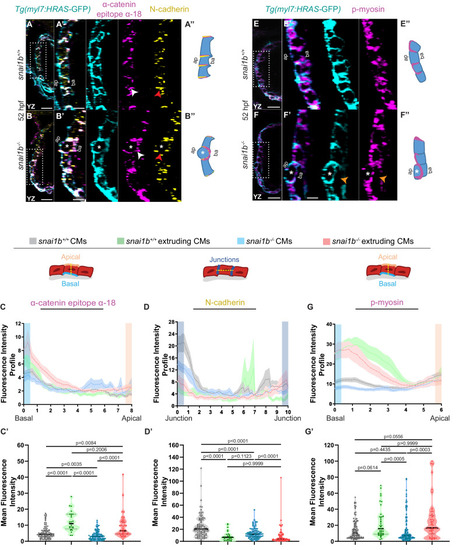
(A–B”) Orthogonal projections in the YZ plane of a 52 hpf snai1b+/+ heart (A) immunostained for α-catenin epitope α-18, N-cadherin, and GFP compared with a snai1b-/- sibling heart (B). Close-up of boxed areas of snai1b+/+ (A’) and snai1b-/- (B’) CMs. Schematics illustrate the localization of activated α-catenin (magenta) in the basal domain of extruding CMs in snai1b-/- embryos and defects in N-cadherin (yellow) localization in the junctional domain of snai1b-/- CMs (A”–B”). (C–D’) Fluorescence intensity profile (FIP) (C–D) and mean fluorescence intensity (mFI) (C’–D’) of α-catenin epitope α-18 and N-cadherin immunostaining in 52 hpf snai1b+/+ and snai1b-/- CMs, and in snai1b+/+ and snai1b-/- extruding CMs. The α-catenin epitope α-18 is observed in the basal domain (white arrowhead in B’) of extruding CMs (white asterisks in B’) in snai1b-/- embryos, and a reduction in junctional N-cadherin (red arrowhead in B’) is observed in snai1b-/- CMs. (FIP α-catenin epitope α-18: snai1b+/+ CMs, N = 179; snai1b+/+ extruding CMs, N = 60; snai1b-/- CMs, N = 140; snai1b-/- extruding CMs, N = 54; mFI α-catenin epitope α-18: snai1b+/+ CMs, N = 90; snai1b+/+ extruding CMs, N = 24; snai1b-/- CMs, N = 88; snai1b-/- extruding CMs, N = 44. FIP N-cadherin: snai1b+/+ CMs, N = 90; snai1b+/+ extruding CMs, N = 12; snai1b-/- CMs, N = 98; snai1b-/- extruding CMs, N = 49; mFI N-cadherin: snai1b+/+ CMs, N = 90; snai1b+/+ extruding CMs, N = 25; snai1b-/- CMs, N = 92; snai1b-/- extruding CMs, N = 70.) (E–F”) Representative images of a 52 hpf snai1b-/- heart (F) immunostained for p-myosin and GFP compared with a snai1b+/+ sibling heart (E). Schematics illustrate the basal enrichment of p-myosin (magenta) in extruding CMs in snai1b-/- embryos (E”–F”). (G–G’) FIP (G) and mFI (G’) of p-myosin immunostaining in snai1b+/+ and snai1b-/- CMs, and in snai1b+/+ and snai1b-/- extruding CMs. p-myosin is enriched basally (orange arrowheads in F’) in snai1b-/- extruding CMs in (white asterisks in F’). (FIP p-myosin: snai1b+/+ CMs, N = 204; snai1b+/+ extruding CMs, N = 60; snai1b-/- CMs, N = 140; snai1b-/- extruding CMs, N = 49; mFI p-myosin: snai1b+/+ CMs, N = 100; snai1b+/+ extruding CMs, N = 29; snai1b-/- CMs, N = 153; snai1b-/- extruding CMs, N = 48). Plot values represent means ± S.E.M. (C, D, G). In the violin plots (C’, D’, G’), solid black lines indicate median. p-values determined by Kruskal–Wallis test (C’, D’, G’). Scale bars: 20 µm (A, B, E, F); 2 µm (A’, B’, E’, F’). ap: apical; ba: basal; N: number of CMs. See also Figure 2—figure supplement 1.
|
