FIGURE SUMMARY
Title

Vitamin E is necessary for zebrafish nervous system development

Authors
Head, B., La Du, J., Tanguay, R.L., Kioussi, C., Traber, M.G.
Source
Full text @ Sci. Rep.

Morphological abnormalities associated with VitE deficiency at 12-, 24- and 48 h post-fertilization. Representative bright field images of E+ and E− embryos showed normal development in E+ embryos and abnormalities in the E− embryos. At 12 hpf, E+ embryos (A) had defined somites and eyes, while E− embryos (B) showed abnormal somite formation and a reduced dorsal region where the eye is usually located. At 24 hpf, E+ embryos (C) had clearly defined eyes, heads and somites, while the E− embryos (D) had pericardial edema, less well-defined somites and notochord. At 48 hpf, E+ embryos (E) had extended fins and pigmentation throughout the body, while the E− embryos (F) experienced severe pericardial edema, stunted fin formation; some E− embryos experience errors in tail formation. (G) Early mortality, defined as nonviable beyond that time point, was increased in E− embryos at 12 hpf. By 48 hpf only about 35% of the original E− clutch survived with about 75% of E+ embryos surviving (P < 0.031) At 24 hpf (H), E− embryos that were alive experienced greater incidences of developmental delay, as well as morphological malformations that include brain, eye, and somites deformities. *Indicate delay or defects in E− embryos relative to E+ . Scale bar represents 500 m. Representative embryos are shown. Figure panels (AF) were generated with the BZ- × 700 microscope, processed with BZ-X Analyzer Software with image adjustments made with Adobe Photoshop v21.2.1.

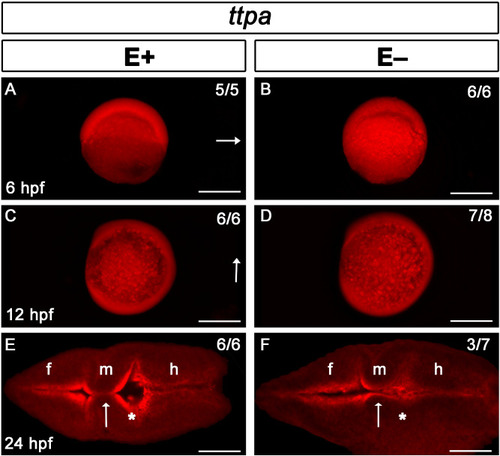
Ttpa signal localized throughout early embryo and brain ventricle borders regardless of VitE status. Ttpa expression in E+ and E− embryos is indicated with red fluorescence; dorsal direction is indicated by arrow (AD). At 6 hpf (dorsal shield stage, A, B), Ttpa expression was present throughout the animal poles [E+ embryos, n = 5/5 (n = number of animals with the observed defect/total number of animals observed)], E− embryos, n = 6/6). At 12 hpf (90% epiboly, C, D), ttpa expression was present both in the embryo and in the yolk syncytial layer (E+ embryos, n = 6/6; E− embryos, n = 7/8 ), arrow indicates anterior region of the embryo. At 24 hpf (E, F), Ttpa expression was localized in the brain ventricle borders and within cells of the fore (f), mid- (m), and hindbrain (h). Arrows indicate the midbrain-hindbrain boundary where diencephalic ventricle expansion was altered; *Represent inflation in E+ embryos (E, n = 6/6) or lack thereof in E− embryos (F, n = 3/7). Scale bar represents 500 μm (A–D) and 50 μm (E, F); representative embryos are shown. Figure panels were generated with the BZ- × 700 microscope, processed with BZ-X Analyzer Software with image adjustments equally applied across time points in Adobe Photoshop v21.2.1.

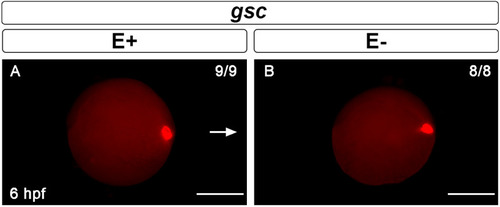
Gastrulation marker goosecoid (gsc) is not affected by VitE deficiency. Gsc expression at 6 hpf in the neuroectoderm of the dorsal embryonic shield, as indicated by red fluorescence in (A) E+ embryos (n = 9/9) and (B) E− embryos (n = 8/8). Arrow indicates dorsal region of the embryo. Scale bar represents 500 μm; representative embryos are shown. Figure panels were generated with the BZ- × 700 microscope, processed with BZ-X Analyzer Software with image adjustments equally applied across time points in Adobe Photoshop v21.2.1.

EXPRESSION / LABELING:
Gene:
Fish:
Condition:
Anatomical Term:
Stage: Shield

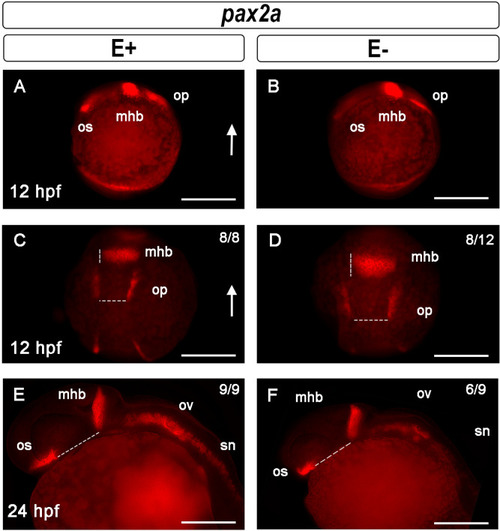
Midbrain-hindbrain boundary formation shown by pax2a expression is dysregulated by VitE deficiency. Pax2a expression in early optic stalk (os), midbrain-hindbrain boundary (mhb) and otic placode (op) in 12 hpf embryos, lateral views (A, B); arrow indicates dorsal region. At 12 hpf, E+ embryos (C) had defined mhb and op borders (n = 8/8), while E− embryos (D) had diffuse mhb and op borders (n = 8/12 assessed). Shown are representative E+ embryo with mhb 25 μm wide and op 49 μm apart, while representative E− embryo measurements were mhb 42 μm wide and op 63 μm apart. At 24 hpf, in E+ (E) and E− embryos (F) pax2a was expressed in the os, mhb, otic vesicles (ov) and spinal cord neurons (sn). Distance between os and mhb, a measure of first brain ventricle inflation, were greater in a representative E+ (91 μm) relative to an E− (80 μm) embryo. E+ embryo (E) spinal cord neurons at the same fluorescence exposure had significantly increased pax2a signal (n = 9/9), as compared with E− embryos (n = 6/9). Scale bar represents 100 μm; representative embryos are shown. Figure panels were generated with the BZ- × 700 microscope, processed with BZ-X Analyzer Software with image adjustments equally applied across time points in Adobe Photoshop v21.2.1.

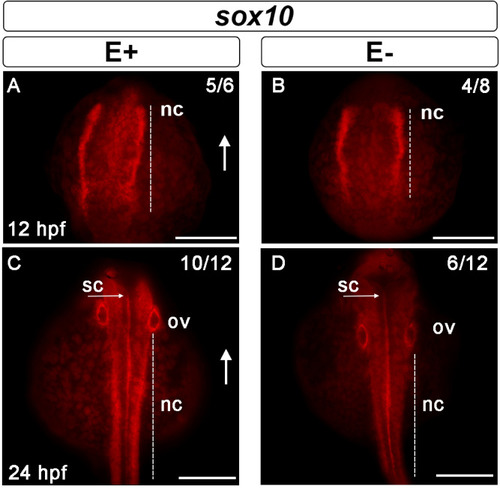
Neural crest cell migration impaired during development by VitE deficiency. Sox10 was expressed in the cells of the neural border at 12 hpf (A, B); arrows indicate dorsal region of the embryo. The extent of the distribution of neural crest cells (nc) expressing sox10 was greater (n = 4/8) in E+ embryos (A) relative to E− embryos (n = 5/6) (B). Measurements in representative embryos were E+ 174 μm relative to E− 145 μm. NC migrate ventrally away from the spinal cord (sc) to differentiate into cranial, cardiac, enteric and sensory neurons and glia. At 24 hpf, sox10 expression around the otic vesicle (ov) was clearly defined in E+ embryos (C) and less well-defined in E− embryos (D). In E+ embryos (C), the migratory NC that flank the developing sc show increased sox10 expression (n = 10/12), while E− embryos (D) had fewer migratory NC with sox10 expression (n = 6/12). Nonetheless, similar spinal cord (s) sox10 expression was observed in E+ and E− embryos. Scale bar represents 100 μm; representative embryos are shown. Figure panels were generated with the BZ- × 700 microscope, processed with BZ-X Analyzer Software with image adjustments equally applied across time points in Adobe Photoshop v21.2.1.

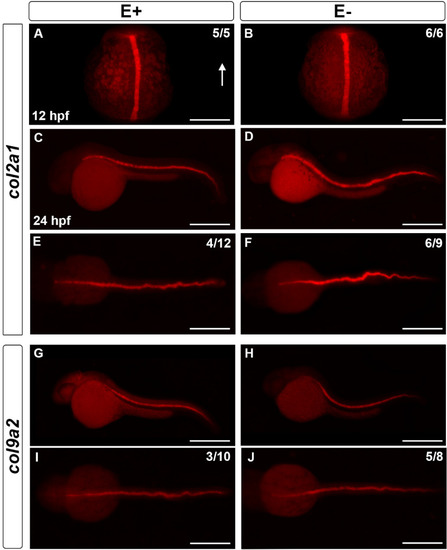
Notochord collagen markers col2a1a and col9a2 affected by dietary treatment. At 12 hpf, col2a1a expression was localized in the developing notochord of E+ (A, n = 5/5) and E− (B, n = 6/6) embryos. Arrow indicates dorsal region of the embryo. At 24 hpf, the notochord sheath in E+ and E− embryos showed col2a1a (C, D) and col9a2 (G, H) expression with a wavy notochord phenotype observed in both groups. The wavy notochord was more apparent when viewing dorsally (E, F, I, J) relative to lateral view (C, D, G, H). At 24 hpf, ~ 25% of E+ embryos (E, n = 4/12) showed a wavy col2a1a expression, while ~ 66% of E− embryos (F, n = 6/9) were obviously wavy; similarly a wavy col9a2 expression was observed in 33% of E+ embryos (I, n = 3/10), while ~ 60% of E− embryos had a wavy expression (J, n = 5/8). Scale bar represents 500 μm (C–J) and 100 μm (A, B); representative embryos are shown. Figure panels were generated with the BZ- × 700 microscope, processed with BZ-X Analyzer Software with image adjustments equally applied across time points in Adobe Photoshop. This figure was created with Adobe Photoshop v21.2.1.

EXPRESSION / LABELING:
Genes:
Fish:
Condition:
Anatomical Term:
Stage Range: 5-9 somites to Prim-5
PHENOTYPE:
Fish:
Condition:
Observed In:
Stage Range: 5-9 somites to Prim-5

Relative gene expression of neurogenesis markers. Log2 fold change of genes measured in E− relative to E+ by RT-qPCR. Ttpa expression was not measured at 12 hpf. Data are as the median fold change, with the box from the 25th to the 75th percentile, the whiskers show the minimum and maximum value.*Indicates a significant difference in gene expression between E− and E+ Ct values.

EXPRESSION / LABELING:
Gene:
Fish:
Condition:
Anatomical Terms:
Stage: Prim-5
PHENOTYPE:
Fish:
Condition:
Observed In:
Stage: Prim-5

Histological analysis of 24 hpf zebrafish embryos with morphological defects associated with VitE status. Hematoxylin and eosin staining of E+ and E− embryos at 24 hpf was used to evaluate morphological defects, including fore- (F) and mid- (M), and hind- (H) brain ventricle inflation, somite formation and notochord vacuolation. Transverse section of E+ embryos had tear-drop shaped-F with eyes to each side (A), whereas E− embryos had a neural lumen, but improperly inflated-F (B). Serial transverse sections of E+ embryos showed normal M ventricle inflation with distinct hinge-points, indicated by *(C). E− embryos (D) had reduced M ventricle inflation with similar hinge points. E+ and E− embryos had similar H inflation leading to the neural tube in the trunk (E, F). Sagittal sections of the trunk indicate defined somite epithelial boundaries in E+ embryos (G) and indistinct epithelial boundaries in E− somitic cells (H). Notochord vacuolation appeared normal in both E+ (I) and E− (J) embryos. Scale bar represents 50 μm; representative embryos are shown. Figure panels were generated with the BZ- × 700 microscope, processed with BZ-X Analyzer Software with image adjustments equally applied across time points in Adobe Photoshop, v21.2.1.

Acknowledgments
This image is the copyrighted work of the attributed author or publisher, and ZFIN has permission only to display this image to its users. Additional permissions should be obtained from the applicable author or publisher of the image. Full text @ Sci. Rep.