
Figure 5
- ID
- ZDB-IMAGE-201003-145
- Genes
- Publication
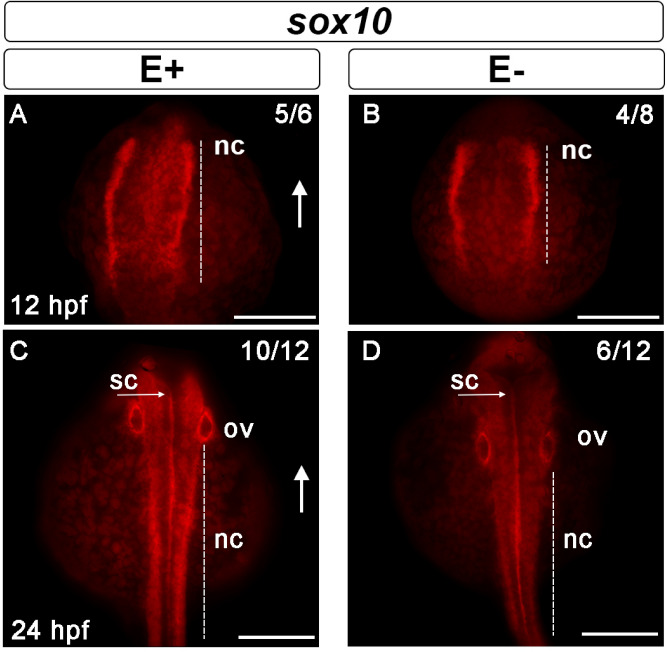
- Head et al., 2020 - Vitamin E is necessary for zebrafish nervous system development
- All Figures
- Figures for Head et al., 2020
|
Figure 5
Neural crest cell migration impaired during development by VitE deficiency. S