
IMAGE
Figure 3
- ID
- ZDB-IMAGE-201003-136
- Genes
- Publication
- Head et al., 2020 - Vitamin E is necessary for zebrafish nervous system development
- All Figures
- Figures for Head et al., 2020
Image
|
Figure Caption
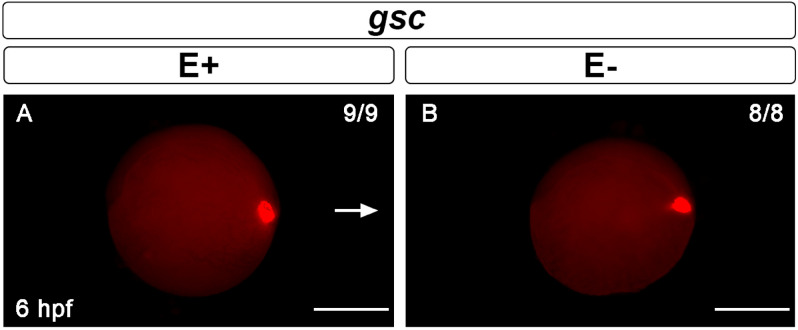
Figure 3
Gastrulation marker goosecoid (
Figure Data
Acknowledgments
This image is the copyrighted work of the attributed author or publisher, and
ZFIN has permission only to display this image to its users.
Additional permissions should be obtained from the applicable author or publisher of the image.
Full text @ Sci. Rep.