FIGURE SUMMARY
Title

THOC1 deficiency leads to late-onset nonsyndromic hearing loss through p53-mediated hair cell apoptosis

Authors
Zhang, L., Gao, Y., Zhang, R., Sun, F., Cheng, C., Qian, F., Duan, X., Wei, G., Sun, C., Pang, X., Chen, P., Chai, R., Yang, T., Wu, H., Liu, D.
Source
Full text @ PLoS Genet.

Pedigrees and genotypes of family SH.

(a) Pedigrees of family SH. The individuals selected for linkage analysis and whole-exome sequencing was marked with asterisks and triangles, respectively. (b) Representative audiograms of family SH. (c) Logarithm of the odds (LOD) scores of genome-wide linkage analysis for chromosome 18. A maximum LOD score of 4.93 was obtained for marker rs928980. (d) Chromatograms of wild type (WT) and mutant (Mut) sequence for c.547C>G (p.L183V). (e) Diagram showing domains of human THOC1 protein and the location of the p.L183V mutation. (f) Multiple sequence alignment of THOC1 showing conservation of the leucine 183 residue.

The expression of THOC1 in hair cells.

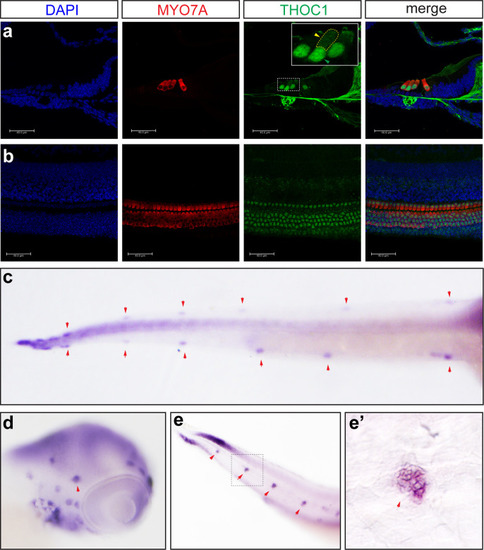
(a, b) Confocal microscopic imaging analysis of THOC1 antibody staining in mouse cochlea hair cells. THOC1 was enriched in outer hair cells (OHC) and inner hair cells (IHC) in the P0 mouse cochlea. Blue: DAPI staining of the cell nuclei. Red: Myosin 7a antibody staining marking hair cells. Green: THOC1 antibody staining. Bars, 40 μm. The region in yellow dash-line rectangle amplified in the white rectangle. Green arrowhead indicates nucleus; yellow arrowhead indicates cytoplasm. (c-e’) whole mount in situ hybridization analysis of expression of thoc1 in 3 dpf zebrafish. (c) Dorsal view, arrowheads indicate neuromasts. (d) Lateral view, arrowheads indicate neuromasts. (e) Lateral view, arrowheads indicate neuromasts. (e’) Lateral view, arrowheads indicate neuromasts. The magnified region of square in (e).

EXPRESSION / LABELING:
Gene:
Fish:
Anatomical Term:
Stage: Protruding-mouth

<italic>Thoc1</italic> deficiency caused hair cell developmental defects in zebrafish.

(a) Fluorescence microscopic imaging analysis of thoc1 mutant Tg(pou4f3:gap43-GFP) line at 3 dpf. Arrowheads indicate hair cell clusters. (b) Statistical analysis of the hair cell clusters in control and thoc1 mutants (control, n = 10; thoc1 mutants, n = 37). t-test, ****, p<0.0001. (c) Fluorescence microscopic imaging analysis of thoc1 mutant Tg(pou4f3:gap43-GFP) line at 4 dpf. Arrowheads indicate hair cell clusters. (d) Statistical analysis of the hair cell clusters in control and thoc1 mutants (control, n = 10; thoc1 mutants, n = 38). t-test, ****, p<0.0001. (e) Confocal microscopic imaging analysis of the neuromasts in control and thoc1 mutants at 3 dpf. Green: Tg(pou4f3:gap43-GFP). Red: Sox2 antibody staining marking supporting cells. Blue: DAPI staining of the cell nuclei. (f, g) Statistical analysis of the hair cell number per neuromasts and total number in trunk of control and thoc1 mutants (control, n = 9; thoc1 mutants, n = 17, control, n = 15; thoc1 mutants, n = 15) at 3 dpf. t-test, ****, p<0.0001. (h) Confocal microscopic imaging analysis of the neuromasts in control and thoc1 mutants at 4 dpf. Green: Tg(pou4f3:gap43-GFP). Red: Sox2 antibody staining marking supporting cells. Blue: DAPI staining of the cell nuclei. (i, j) Statistical analysis of the hair cell number per neuromasts and total number in trunk of control and thoc1 mutants (control, n = 9, thoc1 mutants, n = 17; control, n = 15; thoc1 mutants, n = 15) at 4 dpf. t-test, ****, p<0.0001.

PHENOTYPE:
Fish:
Knockdown Reagent:
Observed In:
Stage Range: Protruding-mouth to Day 4

The THOC1 mutation (p. L183V) impaired its function in hair cell formation.

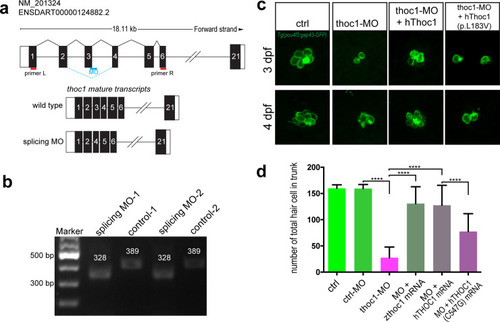
(a) The diagram shows the targeting site of thoc1 splice blocking morpholino and the RT-PCR primers design for validating the knockdown results. The wild type mature transcripts indicate the natural splicing product of thoc1 mRNA. The splicing MO mature transcripts indicate the abnormal splicing product of thoc1mRNA with Exon3 deletion caused by morpholino injection. (b) The agarose gel electrophoresis image shows the 61bp Exon3 deletion. (c) Confocal microscopic imaging analysis of the hair cells in control, thoc1-MO, thoc1 -MO + hThoc1 mRNA, and thoc1-MO + hThoc1 (p. L183V) mRNA Tg(pou4f3:gap43-GFP) at 3 dpf and 4 dpf. (d) Statistical analysis of the total hair cell number in trunk of control (n = 15), control-MO (n = 15), thoc1-MO (n = 15), thoc1-MO + zthoc1 mRNA (n = 15), thoc1-MO + hThoc1 mRNA (n = 15), and thoc1-MO + hThoc1 (p. L183V) mRNA at 4 dpf (n = 15). One-way ANOVA, ****, p<0.0001.

PHENOTYPE:
Fish:
Knockdown Reagent:
Observed In:
Stage Range: Protruding-mouth to Day 4

Inactivation of <italic>thoc1</italic> induced apoptosis in neuromasts.

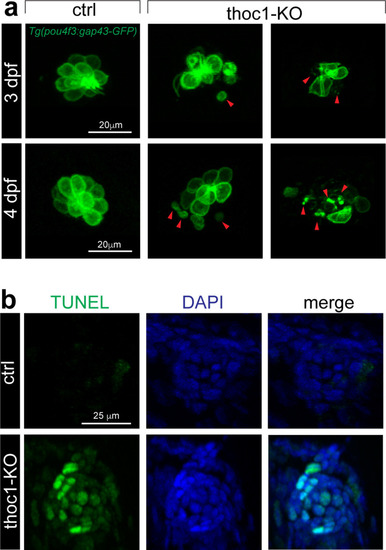
(a) Confocal microscopic imaging analysis of the hair cells in control and thoc1-KO Tg(pou4f3:gap43-GFP) at 3 and 4 dpf. Arrowheads indicate the abnormal hair cells. (b) TUNEL analysis of the neuromasts in control and thoc1-KO embryos at 4 dpf. Green: TUNEL staining. Blue: DAPI staining of the cell nuclei.

Transcriptome sequencing analysis of 48 hpf <italic>thoc1</italic> mutants.

(a) Clustering analysis indicates the replicates within group have a good repeatability, while the control and mutated group are different. (b) Volcano diagram of different expression genes. Red dots indicate up-regulated genes; blue dots indicate down-regulated genes. Abscissa indicates gene fold change in different samples; ordinate represents statistical significance of gene expression change. (c) KEGG analysis plot of the differential gene, with the vertical axis representing the pathway and the horizontal axis representing the Rich factor. The size of the dot indicates the number of differentially expressed genes in the pathway, and the color of the dot corresponds to a different Qvalue range. (d) Relative mRNA levels of p53 in control and thoc1-KO embryos at 48 hpf and 4 dpf (three times experiments, n = 10 for each time). t-test; ***, p<0.001; ****, p<0.0001. (e) Relative mRNA levels of bax, casp3 and casp9 in control and thoc1-KO embryos at 4 dpf (three times experiments, n = 10 for each time), t-test; **, p<0.01; ***, p<0.001; ****, p<0.0001.

EXPRESSION / LABELING:
Genes:
Fish:
Knockdown Reagent:
Anatomical Term:
Stage Range: Long-pec to Day 4
PHENOTYPE:
Fish:
Knockdown Reagent:
Observed In:
Stage Range: Long-pec to Day 4

Inhibition of P53 signaling alleviated the <italic>thoc1</italic>-deficiency induced apoptosis in neuromasts.

(a, b) Statistical analysis of the hair cell clusters in control (n = 8), ctrl + P53 inhibitor treatment (n = 9), thoc1 KO (n = 8), and thoc1 KO + P53 inhibitor treatment embryos (n = 7). One-way ANOVA, ****, p<0.0001; ***, p<0.001; **, p<0.01. (c) TUNEL analysis of the neuromasts in control (n = 7), thoc1 KO (n = 7), and thoc1 KO + P53 inhibitor treatment embryos (n = 7). Green: TUNEL staining. Blue: DAPI staining of the cell nuclei. (d) Statistical analysis of the number of apoptotic cells per neuromast in control, thoc1 KO, and thoc1 KO + P53 inhibitor treatment embryos. One-way ANOVA, ****, p<0.0001.

ZFIN is incorporating published figure images and captions as part of an ongoing project. Figures from some publications have not yet been curated, or are not available for display because of copyright restrictions.

PHENOTYPE:
Fish:
Knockdown Reagent:
Observed In:
Stage Range: Long-pec to Protruding-mouth

ZFIN is incorporating published figure images and captions as part of an ongoing project. Figures from some publications have not yet been curated, or are not available for display because of copyright restrictions.

PHENOTYPE:
Fish:
Knockdown Reagent:
Observed In:
Stage: Protruding-mouth

ZFIN is incorporating published figure images and captions as part of an ongoing project. Figures from some publications have not yet been curated, or are not available for display because of copyright restrictions.

PHENOTYPE:
Fish:
Knockdown Reagent:
Observed In:
Stage: Adult
Acknowledgments
This image is the copyrighted work of the attributed author or publisher, and ZFIN has permission only to display this image to its users. Additional permissions should be obtained from the applicable author or publisher of the image. Full text @ PLoS Genet.