IMAGE

Fig 3

ID
ZDB-IMAGE-200829-82
Source
Figures for Zhang et al., 2020
Image
Figure Caption

Fig 3 <italic>Thoc1</italic> deficiency caused hair cell developmental defects in zebrafish.

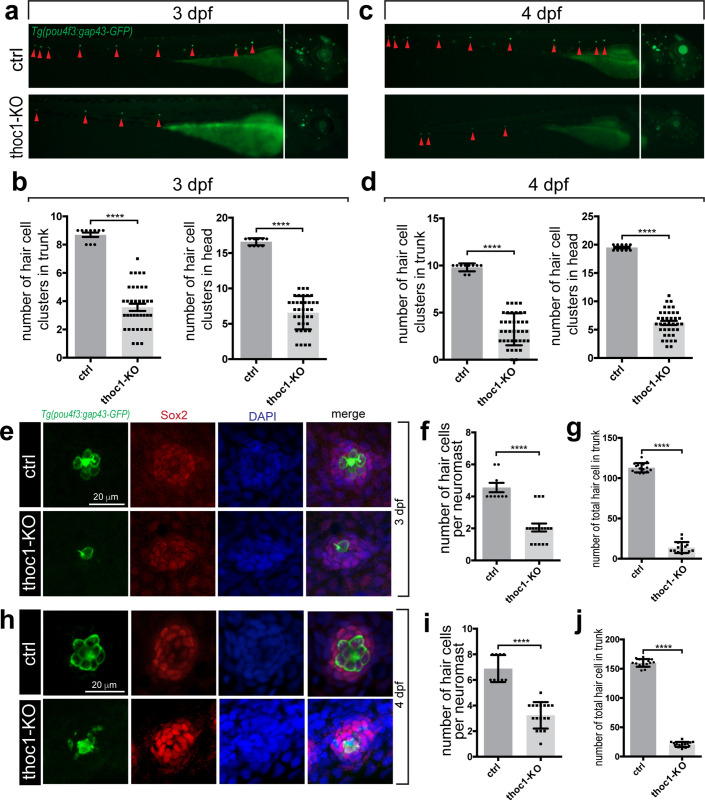
(a) Fluorescence microscopic imaging analysis of thoc1 mutant Tg(pou4f3:gap43-GFP) line at 3 dpf. Arrowheads indicate hair cell clusters. (b) Statistical analysis of the hair cell clusters in control and thoc1 mutants (control, n = 10; thoc1 mutants, n = 37). t-test, ****, p<0.0001. (c) Fluorescence microscopic imaging analysis of thoc1 mutant Tg(pou4f3:gap43-GFP) line at 4 dpf. Arrowheads indicate hair cell clusters. (d) Statistical analysis of the hair cell clusters in control and thoc1 mutants (control, n = 10; thoc1 mutants, n = 38). t-test, ****, p<0.0001. (e) Confocal microscopic imaging analysis of the neuromasts in control and thoc1 mutants at 3 dpf. Green: Tg(pou4f3:gap43-GFP). Red: Sox2 antibody staining marking supporting cells. Blue: DAPI staining of the cell nuclei. (f, g) Statistical analysis of the hair cell number per neuromasts and total number in trunk of control and thoc1 mutants (control, n = 9; thoc1 mutants, n = 17, control, n = 15; thoc1 mutants, n = 15) at 3 dpf. t-test, ****, p<0.0001. (h) Confocal microscopic imaging analysis of the neuromasts in control and thoc1 mutants at 4 dpf. Green: Tg(pou4f3:gap43-GFP). Red: Sox2 antibody staining marking supporting cells. Blue: DAPI staining of the cell nuclei. (i, j) Statistical analysis of the hair cell number per neuromasts and total number in trunk of control and thoc1 mutants (control, n = 9, thoc1 mutants, n = 17; control, n = 15; thoc1 mutants, n = 15) at 4 dpf. t-test, ****, p<0.0001.

Figure Data
Acknowledgments
This image is the copyrighted work of the attributed author or publisher, and ZFIN has permission only to display this image to its users. Additional permissions should be obtained from the applicable author or publisher of the image. Full text @ PLoS Genet.