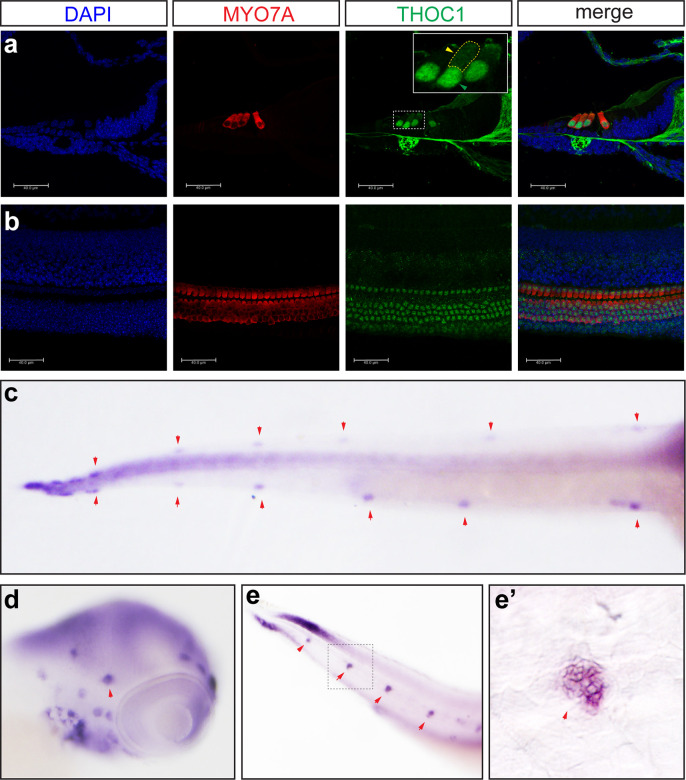
IMAGE

Fig 2

ID
ZDB-IMAGE-200829-81
Genes
Source
Figures for Zhang et al., 2020
Image
Figure Caption

Fig 2 The expression of THOC1 in hair cells.

(a, b) Confocal microscopic imaging analysis of THOC1 antibody staining in mouse cochlea hair cells. THOC1 was enriched in outer hair cells (OHC) and inner hair cells (IHC) in the P0 mouse cochlea. Blue: DAPI staining of the cell nuclei. Red: Myosin 7a antibody staining marking hair cells. Green: THOC1 antibody staining. Bars, 40 μm. The region in yellow dash-line rectangle amplified in the white rectangle. Green arrowhead indicates nucleus; yellow arrowhead indicates cytoplasm. (c-e’) whole mount in situ hybridization analysis of expression of thoc1 in 3 dpf zebrafish. (c) Dorsal view, arrowheads indicate neuromasts. (d) Lateral view, arrowheads indicate neuromasts. (e) Lateral view, arrowheads indicate neuromasts. (e’) Lateral view, arrowheads indicate neuromasts. The magnified region of square in (e).

Figure Data
Acknowledgments
This image is the copyrighted work of the attributed author or publisher, and ZFIN has permission only to display this image to its users. Additional permissions should be obtained from the applicable author or publisher of the image. Full text @ PLoS Genet.