- Title
-
Integrin α5 and Integrin α4 cooperate to promote endocardial differentiation and heart morphogenesis
- Authors
- Schumacher, J.A., Wright, Z.A., Owen, M., Bredemeier, N.O., Sumanas, S.
- Source
- Full text @ Dev. Biol.
|
Fig. 1. itga5 mRNA is expressed in the heart. (A) ISH for itga5 shows that it is enriched on the left side of the embryo at 24 hpf, indicated by the oval. Bracket indicates itga5 expression in the region of the developing pharyngeal arches. (B–D) Volume reconstructions of fluorescent ISH for itga5 (red, D) and immunofluorescence for kdrl:GFP (green, C) reveal that the itga5 expression domain broadly overlaps with the endocardial tube at 24 hpf. (E–G) A single slice from the Z-stack confirms colocalization of itga5 mRNA and GFP expression in an endocardial cell, indicated by white arrows. (H–J) Volume reconstructions of fluorescent ISH for itga5 (red, J) and immunofluorescence for myl7:GFP (green, I) reveal that the itga5 expression domain broadly overlaps with the myocardial tube at 24 hpf. (K–M) A single slice from the Z-stack confirms colocalization of itga5 mRNA and GFP expression in myocardial cells, indicated by white arrows. Dorsal views, anterior to the top. EXPRESSION / LABELING:
|
|
Fig. 2. itga5 mutant embryos have endocardial defects. (A, B) Sibling and itga5 mutant embryos at 28 hpf. (C, D) Sibling and itga5 mutant embryos at 48 hpf. Lateral views, arrowheads indicate pericardial edema that is visible in itga5 mutants at both stages. Scale bar is 200 μm. (E–H) nfatc1 expression analyzed by ISH is reduced to varying degrees in the endocardium of itga5 mutants compared to siblings. (I–K) kdrl expression is normal in the itga5 mutant endocardium, but the morphology of the endocardium is abnormal compared to siblings. Arrowheads indicate endocardium. Embryos in E-K are at 28 hpf, dorsal views. |
|
Fig. 3. Endocardial specification is normal in itga5 mutants, whereas endocardial sheet formation is slightly delayed in itga5 mutants. (A–D) fn1 is expressed in endocardial progenitors of itga5 mutants at both 16 somite and 20 somite stages, but the expression domain is split or partially split. (E–H) fli1a expression in itga5 siblings and mutants at both 16 somite and 20 somite stages. Dorsal views, arrowheads indicate midline of endocardial sheet. Arrows in B and F indicate pools of endocardial progenitors that remain in more lateral locations compared to siblings. Arrow in G indicates condensation of endocardial cells in the middle of the endocardial sheet. EXPRESSION / LABELING:
PHENOTYPE:
|
|
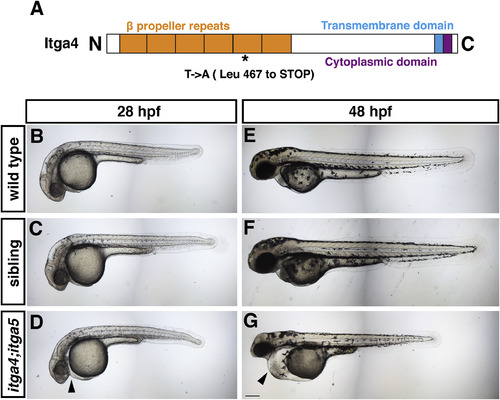
Fig. 4. itga4;itga5 double mutants have cardiovascular defects. (A) Schematic of Itga4 protein indicating the position of the premature stop codon at position 467 in the fifth β propeller repeat. (B–D) Wild type, sibling, and itga4;itga5 double mutants at 28 hpf. (E–G) Wild type, sibling, and itga4;itga5 double mutants at 48 hpf. Sibling and double mutant embryos were obtained from an incross of itga4-/-;itga5+/− adults. Wild type embryos were obtained from separate crosses performed at the same time. Lateral views, arrowheads indicate pericardial edema. Scale bar is 200 μm. |
|
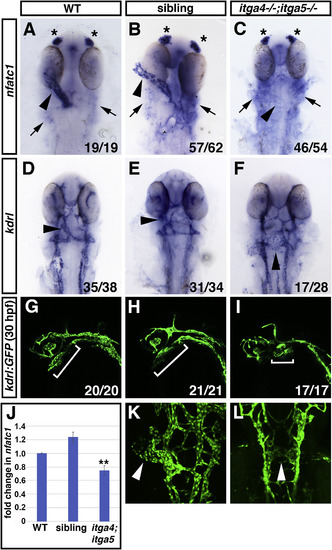
Fig. 5. itga4;itga5 double mutants have endocardial differentiation and morphology defects. (A–C) nfatc1 expression analyzed by ISH is strongly reduced or absent in the endocardium of itga4;itga5 double mutants compared to siblings and WT embryos. Asterisks indicate nfact1 expression in olfactory placodes. Arrows indicate nfatc1 expression in pharyngeal cells. (D–F) kdrl expression is normal in the endocardium of itga4;itga5 double mutants, but the endocardium does not form a tube in itga4;itga5 double mutants compared to siblings and WT embryos. Dorsal views, arrowheads indicate endocardium. (G-I, K-L) Confocal images of kdrl:GFP expression in endothelial cells reveals that the endocardial tube fails to form in itga4;itga5 double mutants at 30 hpf. Lateral views in G-I, brackets indicate position of endocardial tissue. Dorsal views in K, L, arrowheads indicate endocardial tissue. (J) qPCR for nfatc1 expression at 28 hpf. ∗∗ indicates p < 0.005, comparing itga4;itga5 double mutants to either WT or siblings using Student’s T test. Error bars indicate SEM. |
|
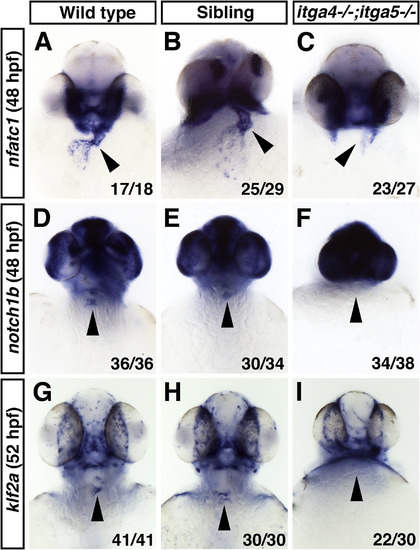
Fig. 6. Expression of endocardial genes is reduced or absent in itga4;itga5 double mutants at later stages. (A–C) nfatc1 expression is reduced or absent in the endocardium of itga4;itga5 double mutants compared to siblings and WT at 48 hpf. (D–F) notch1b expression in the AV canal endocardium is absent in itga4;itga5 double mutants compared to siblings and WT at 48 hpf. (G–I) klf2a expression in the AV canal endocardium is absent in itga4;itga5 double mutants compared to siblings and WT at 52 hpf. Frontal views, arrowheads indicate AV canal region of the endocardium. |
|
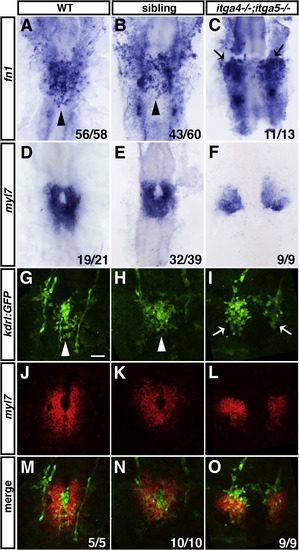
Fig. 7. Defects in medial migration of endocardial and myocardial cells in itga4;itga5 double mutants. (A–C) fn1 expression in endocardial progenitors is normal but progenitors remain bilateral in itga4;itga5 double mutants compared to sibling and WT embryos. Arrowheads indicate endocardial cells at the midline. Arrows indicate endocardial cells that remain in lateral positions. (D–F) myl7 expression in differentiated myocardial cells is normal but cells remain bilateral in itga4;itga5 double mutants compared to sibling and WT embryos. (G–I) Immunofluorescence of kdrl:GFP expression in the endocardium of WT, sibling embryos, and itga4;itga5 double mutants. White arrowheads indicate endocardial cells at the midline. White arrows indicate endocardial cells in lateral positions. (J–L) Fluorescent ISH for myl7 expression in myocardial cells of WT, sibling embryos, and itga4;itga5 double mutants. (M–O) Overlap of kdrl:GFP and myl7 expression reveals that endocardial and myocardial cells are both located in bilateral regions of the ALPM in itga4;itga5 double mutants. Dorsal views, anterior to the top. All embryos are at 20 somites. Scale bar is 50 μm. EXPRESSION / LABELING:
PHENOTYPE:
|
|
Fig. 8. itga4;itga5 double mutants have defects in myocardial morphogenesis and anterior endodermal sheet formation. (A–C) ISH for myl7 shows that myocardial cells eventually migrate to the midline in half of the itga4;itga5 double mutants, while the other half of itga4;itga5 double mutants have a cardia bifida phenotype. Arrow indicates trailing myocardial cells. (D–F) ISH for myl7 shows that the myocardial migration defect is weaker in itga5 single mutants than in itga4;itga5 double mutants. (G–L) ISH for axial (foxa2) expression in the anterior endodermal sheet of WT, sibling embryos, and itga4;itga5 double mutants. Parts of the anterior endodermal sheet are narrower or missing in itga4;itga5 double mutants. (M–P) Two-color ISH for foxa2 (blue) and myl7 (red) shows that the myocardial cells can migrate to the midline in about half of itga4;itga5 double mutants that have a very narrow or absent endodermal sheet. Arrowheads indicate myocardium. Scale bar is 20 μm. |
Reprinted from Developmental Biology, 465(1), Schumacher, J.A., Wright, Z.A., Owen, M., Bredemeier, N.O., Sumanas, S., Integrin α5 and Integrin α4 cooperate to promote endocardial differentiation and heart morphogenesis, 46-57, Copyright (2020) with permission from Elsevier. Full text @ Dev. Biol.


