
- Title
-
RNA 5-Methylcytosine Facilitates the Maternal-to-Zygotic Transition by Preventing Maternal mRNA Decay
- Authors
- Yang, Y., Wang, L., Han, X., Yang, W.L., Zhang, M., Ma, H.L., Sun, B.F., Li, A., Xia, J., Chen, J., Heng, J., Wu, B., Chen, Y.S., Xu, J.W., Yang, X., Yao, H., Sun, J., Lyu, C., Wang, H.L., Huang, Y., Sun, Y.P., Zhao, Y.L., Meng, A., Ma, J., Liu, F., Yang, Y.G.
- Source
- Full text @ Mol. Cell
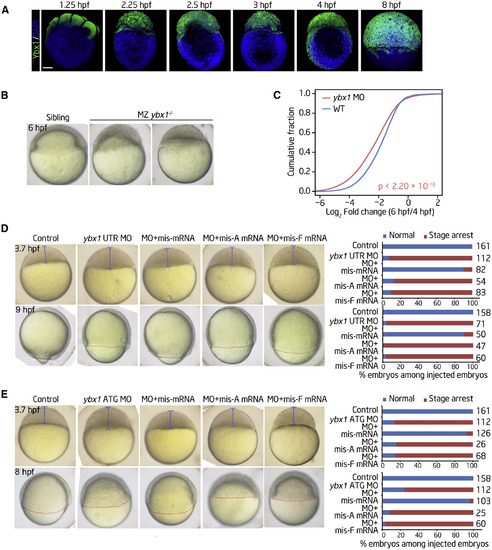
Ybx1 Is Involved in Zebrafish Early Embryogenesis (A) Immunofluorescence showing the protein levels of Ybx1 at the indicated stages. Scale bar, 200 μm. (B) Time-matched images of embryos showing that the ybx1 MZ mutant experiences an early-stage delay maintained throughout early development. (C) The fold changes in gene expression levels during MZT in control and ybx1 morphants as detected through RNA-seq. p values were calculated using two-sided Wilcoxon and Mann-Whitney tests. (D and E) Zebrafish embryos and histograms displaying the rescue effect after coinjection of the ybx1 UTR MO (D) or the ATG MO (E) and different ybx1 mRNAs at the blastula or gastrula period. Shown are representative images of embryos (left) and histograms (right) displaying the rescue effect after coinjection of ybx1 MOs and mismatched wild-type (WT, mis-mRNA) or mutated (W45A, mis-A mRNA; W45F, mis-F mRNA) ybx1 mRNAs at the indicated time points. The numbers on the x axis and to the right of each bar indicate the embryo count with the same morphological characteristics as the presented image and the total number of embryos used for the experiment, respectively. EXPRESSION / LABELING:
PHENOTYPE:
|

ZFIN is incorporating published figure images and captions as part of an ongoing project. Figures from some publications have not yet been curated, or are not available for display because of copyright restrictions. EXPRESSION / LABELING:
|

Ybx1 and Pabpc1a Mediated m5C Protects Maternal mRNA Stability in Early Zebrafish Embryos (A) Pabpc1a morphants display developmental arrest similar to that of ybx1 morphants or ybx1 and pabpc1a MO-coinjected embryos. (B) qRT-PCR analysis showing the decreased expression of three representative genes in pabpc1a morphants or in embryos coinjected with ybx1 and pabpc1a MOs. Error bars represent mean ± SD; n = 3. ∗∗p < 0.01, ∗∗∗p < 0.001, ∗∗∗∗p < 0.0001, two-tailed Student’s t test. (C) The in vivo degradation of cap1-WT or tpp2-WT mRNAs was faster in ybx1 morphants than in control embryos. mRNA abundance was determined by qRT-PCR. Error bars represent mean ± SD; n = 3. ∗∗∗p < 0.001, two-tailed Student’s t test. (D and E) Representative images (D) and quantification (E) of the relative expression levels of the WT products of cap1 and tpp2 in embryos with or without ybx1 deficiency at the sphere stage of development. The cap1-WT and tpp2-WT GFP reporter mRNAs produced lower GFP protein levels in ybx1 morphants than in control embryos. Scale bar, 500 μm. Error bars represent mean ± SD; n = 14. ∗∗∗∗p < 0.0001, two-tailed Student’s t test. (F) qRT-PCR showing the expression of cap1-WT in control embryos and ybx1 morphants at the indicated time points during MZT. RNA abundance was determined by qRT-PCR and normalized to the 0 hpf values. β-Actin served as an internal RNA control. Error bars represent mean ± SD; n = 3. ∗p < 0.05, ∗∗p < 0.01, two-tailed Student’s t test. (G) qRT-PCR showing the expression of cap1- m5C (cyan) and cap1-C (black) reporter RNAs in control embryos at the indicated time points during MZT. RNA abundance was determined by qRT-PCR and normalized to 0 hpf values. β-Actin served as an internal RNA control. Error bars represent mean ± SD; n = 3. ∗∗p < 0.01, ∗∗∗p < 0.001, two-tailed Student’s t test. (H) Schematic model of the dynamic regulation of maternal mRNA decay by m5C during zebrafish MZT. Maternal mRNAs without m5C modification are degraded rapidly through deadenylation during MZT, whereas a subset of maternal mRNAs with m5C modifications can be protected from degradation through m5C site recognition by the Ybx1 complex, which leads to the stabilization of mRNAs and subsequently enables the performance of their associated functions during early embryogenesis. The p values in (B), (C), and (E)–(G) were all determined using two-tailed Student’s t tests. |

Generation and Characterization of Ybx1 Mutant Zebrafish and Phenotypes of Ybx1 MO-injected Embryos. Related to Figure 3. (A) In situ hybridization results revealing the expression profile of ybx1 mRNA. (B) RNA-Seq results revealing the expression profile of ybx1 mRNA. The expression levels were normalized by the RPKM of gapdh in the corresponding stages. (C) Graphical representation of the target site in the fifth exon of ybx1 used for the design of mutants through a CRISPR/Cas9 strategy. The lower panel shows the 2 bp insertion in the ybx1 target site. (D) Whole mount in situ hybridization analysis results showing the lack of expression of ybx1 in the ybx1 mutant. (E and F) Western blotting (E) and immunofluorescence (F) results showing that Ybx1 protein was undetectable in the homozygous mutants. -Actin served as a protein loading control. Scale bar: 200 m. (G) Design of the ybx1 MO that targeted the 5’UTR (UTR MO) or the start codon (ATG MO) of ybx1 mRNA. EXPRESSION / LABELING:
PHENOTYPE:
|
|
ZFIN is incorporating published figure images and captions as part of an ongoing project. Figures from some publications have not yet been curated, or are not available for display because of copyright restrictions. |

(A) Western blotting of Pabpc1a showing the knockdown efficiency of two different MOs (the ATG MO and the Splice MO). Actin served as a protein loading control. 12 (B) Time-matched images of embryos showing the effects of the pabpc1a Splice MO on early development. Left; representative images of embryos; right: histogram. The numbers on the x-axis and to the right of each bar indicate the embryo count with the same morphological characteristics as the presented images and the total number of embryos used for the experiment, respectively. (C) Western blots showing the knockdown efficiency of the Splice MO and the overexpression efficiency achieved with Flag-pabpc1a mRNA. Actin served as a protein loading control. (D) Zebrafish embryo images and histogram displaying the attenuating effect of coinjection of the pabpc1a ATG MO and pabpc1a mRNA during the blastula or gastrula period. Left; representative images of embryos; right: histogram. The numbers on the x-axis and to the right of each bar indicate the embryo count with the same morphological characteristics as the presented image and the total number of embryos used for the experiment, respectively. (E) Schematic representation of four minigene constructs based on the pCS2-EGFP backbone. pCS2-EGFP-cap1-WT contains one m5C site (Cyt1267 from the start codon AUG) (EGFP-cap1-WT). Ser423 (UCC) was synonymously mutated to Ser423 (agC) to generate EGFP-cap1-MUT. pCS2-EGFP-tpp2-WT contains one m5C site (Cyt830 from start codon AUG) (EGFP-tpp2-WT). Pro280 (CCC) was synonymously mutated to Pro280 (CCg) to generate the tpp2-MUT construct. (F) The in vivo degradation of cap1-MUT and tpp2-MUT mRNAs was not affected by ybx1 deficiency. mRNA abundance was determined by qRT-PCR. Error bars, mean ± SD, n = 3. ns, not significant with p < 0.05, two-tailed Student’s t-test. (G and H) Representative images (G) and quantification (H) of the relative expression levels of the MUT products of cap1 and tpp2 in embryos with or without ybx1 deficiency at the sphere stage of development. The cap1-MUT and tpp2-MUT GFP reporter mRNAs produced comparable GFP protein levels in ybx1 morphants versus control embryos. Scale bar: 500 m. Error bars, mean ± SD, n = 9-14. ns, not significant with p < 0.05, two-tailed Student’s t-test. (I) qRT-PCR results showing the expression of the cap1-MUT reporter RNA in control 13 embryos and ybx1 morphants at indicated time points during the MZT. mRNA abundance was determined by qRT-PCR and normalized to the values at 0 hpf. -Actin served as an internal RNA control. Error bars, mean ± SD, n = 3. ns, not significant with p < 0.05, two-tailed Student’s t-test. (J) Schematic representation of the newly synthesized reporter RNAs based on cap1 mRNA. The first oligo (Oligo 1) contains 15 nt of GFP sequence and 44 nt of cap1 RNA with or without an m5C modification site. Oligo 2-poly(A) contains a 30 nt poly(A) tail. Oligo 1, Oligo 2 and Oligo 2-poly(A) were synthesized in vitro and ligated through splint ligation with DNA bridge oligos as templates. (K and L) qRT-PCR results showing the expression of the cap1- m5C (cyan) and cap1- C (black) reporter RNAs in embryos with ybx1 (K) or pabpc1a (L) at the indicated time points during the MZT. RNA abundance was determined by qRT-PCR and normalized to the value at 0 hpf. -Actin served as an internal RNA control. Error bars, mean ± SD, n = 3. ns, not significant with p < 0.05, two-tailed Student’s t-test. (M) qRT-PCR results showing the expression of the cap1- m5C-poly(A) (cyan) and cap1-C-poly(A) (black) reporter RNAs in control embryos at the indicated time points during the MZT. RNA abundance was determined by qRT-PCR and normalized to the value at 0 hpf. -Actin served as an internal RNA control. Error bars, mean ± SD, n = 3. *p < 0.05, ***p < 0.001, ****p < 0.0001, two-tailed Student’s t-test. (N) RIP-qPCR analysis results showing the binding affinities of Ybx1 (left) and Pabpc1a (right) for the m5C-modified (cyan) and unmodified control (black) reporter RNAs. Error bars, mean ± SD, n = 3. ***p < 0.001, ****p < 0.0001, two-tailed Student’s t-test |