
Fig. 3
- ID
- ZDB-IMAGE-200121-8
- Genes
- Publication
- Yang et al., 2019 - RNA 5-Methylcytosine Facilitates the Maternal-to-Zygotic Transition by Preventing Maternal mRNA Decay
- All Figures
- Figures for Yang et al., 2019
|
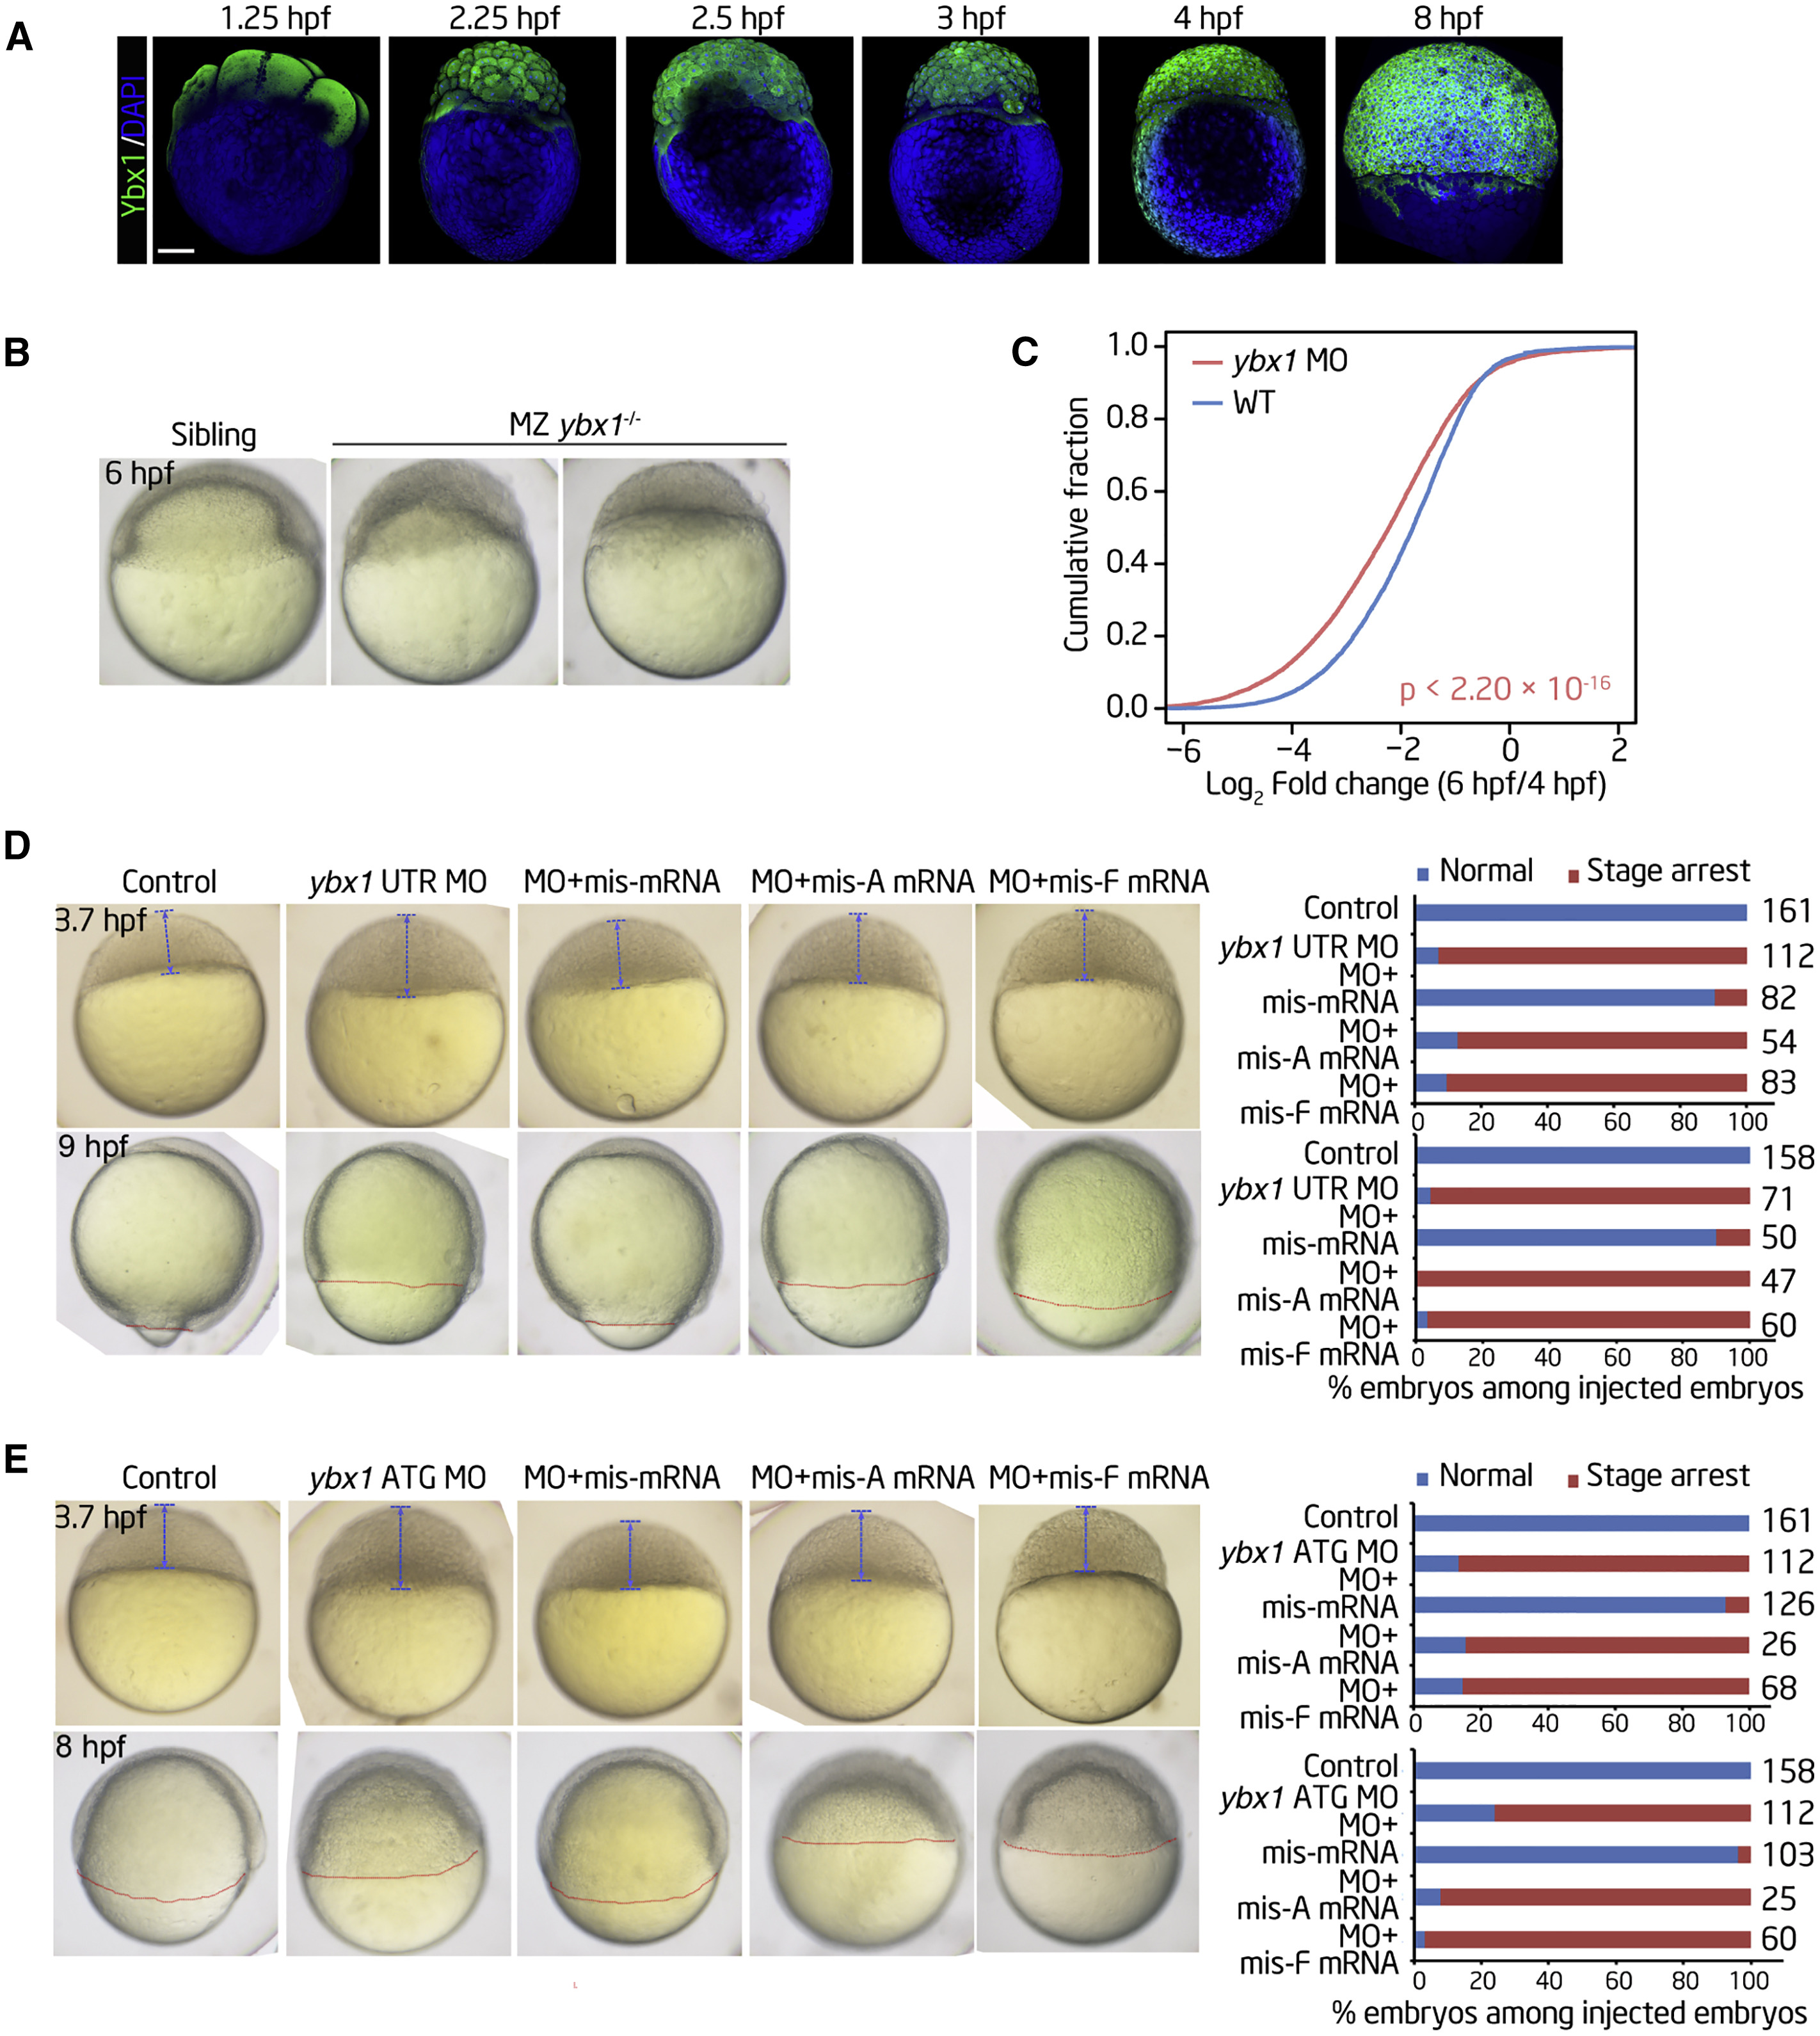
Fig. 3
Ybx1 Is Involved in Zebrafish Early Embryogenesis
(A) Immunofluorescence showing the protein levels of Ybx1 at the indicated stages. Scale bar, 200 μm.
(B) Time-matched images of embryos showing that the ybx1 MZ mutant experiences an early-stage delay maintained throughout early development.
(C) The fold changes in gene expression levels during MZT in control and ybx1 morphants as detected through RNA-seq. p values were calculated using two-sided Wilcoxon and Mann-Whitney tests.
(D and E) Zebrafish embryos and histograms displaying the rescue effect after coinjection of the ybx1 UTR MO (D) or the ATG MO (E) and different ybx1 mRNAs at the blastula or gastrula period. Shown are representative images of embryos (left) and histograms (right) displaying the rescue effect after coinjection of ybx1 MOs and mismatched wild-type (WT, mis-mRNA) or mutated (W45A, mis-A mRNA; W45F, mis-F mRNA) ybx1 mRNAs at the indicated time points. The numbers on the x axis and to the right of each bar indicate the embryo count with the same morphological characteristics as the presented image and the total number of embryos used for the experiment, respectively.