
- Title
-
Zebrafish Models for Human Acute Organophosphorus Poisoning
- Authors
- Faria, M., Garcia-Reyero, N., Padrós, F., Babin, P.J., Sebastián, D., Cachot, J., Prats, E., Arick Ii, M., Rial, E., Knoll-Gellida, A., Mathieu, G., Le Bihanic, F., Escalon, B.L., Zorzano, A., Soares, A.M., Raldúa, D.
- Source
- Full text @ Sci. Rep.
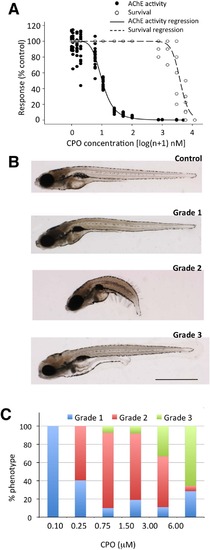
Chlorpyrifos-oxon (CPO) induces concentration-dependent inhibition of acetylcholinesterase (AChE) and the expression of three different phenotypes in zebrafish larvae. (A) Concentration-response analysis of CPO regarding the inhibition of AChE activity and survival in zebrafish larvae exposed to different CPO concentrations from 7 to 8 days post fertilization (24 h exposure, 16 larvae per experimental group, p < 0.0001; AChE activity, F(1,143) = 1950.77, r2 = 0.978; survival, F(1,59) = 251.295, r2 = 0.9208). (B) Lateral views of representative 8 days post fertilization larvae control and the mild (grade 1), moderate (grade 2) and severe (grade 3) phenotypes. (C) Prevalence of the three different phenotypes in response to different CPO concentrations (48 larvae per experimental group). Scale bar: 1 mm. |
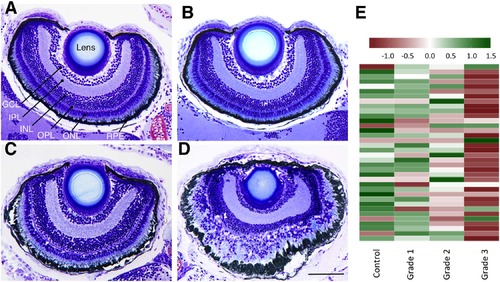
CPO induces concentration-dependent impairment of the retina architecture and the phototransduction pathways in zebrafish larvae. Retinal histology (transverse plastic semithin sections) of representative control (A), grade 1 (B) grade 2 (C) and grade 3 (D) 8 days post fertilization zebrafish larvae shows a good relationship between the grade of the phenotype and the severity of the effects on the retinal architecture. (E) Heatmap of the phototransduction pathway (dre04744) in zebrafish control and grades 1, 2 and 3 larvae, showing a clear relationship between the grade of phenotype severity and the degree of down-regulation of this pathway. Abbreviations: GCL, ganglion cell layer; INL, inner nuclear layer; IPL, inner plexiform layer; ONL, outer nuclear layer; OPL; outer plexiform layer; RPE, retinal pigment epithelium. Scale bar: 100 µm. |
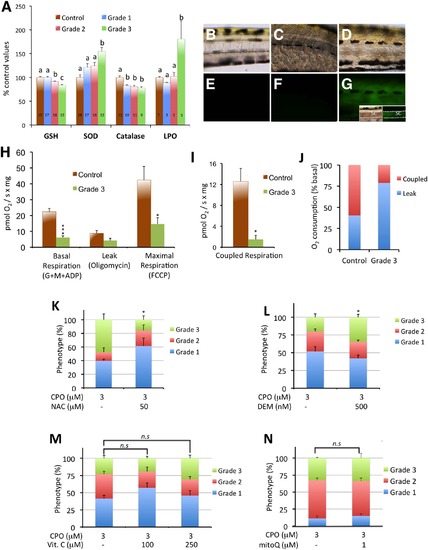
Oxidative stress is only induced in grade 3 larvae. (A) SOD and catalase activities and GSH and MDA (LPO) levels in control and grade 1–3 zebrafish larvae exposed from 7 to 8 days post fertilization (dpf). The data represent the mean ± SEM. The value on each bar indicates the number of pools for each condition, and bars with different letters are significantly different (p < 0.05, one-way ANOVA with Tukey’s multiple comparison test). (B–G) Brightfield (B–D) and fluorescence (E–G) images of the trunks of representative 8 dpf control (B,E), grade 2 (C,F), and grade 3 (D,G) larvae phenotypes. The oxidative fluorescent dye DCFH-DA, which is used for identifying ROS generation in live larvae, showed high ROS generation in grade 3 muscle fibres and spinal cord (G) compared to grade 2 (F) and control (E). Inset at (G) shows brightfield and fluorescence images of the trunk of a grade 3 larva, with the focal plane at the level of the spinal cord. Dorsal and ventral limits of the spinal cord are highlighted by a white dotted line. Abbreviations: sc, spinal cord. (H–J) Grade 3 larvae exhibit a significant reduction in mitochondrial respiration. The basal and maximal respiration (H) and the coupled respiration (I) were strongly reduced in grade 3 larvae with respect to the control larvae (3–11 pools with 20–25 larvae each were analysed for each group; *p < 0.05, ***p < 0.001, Student’s t-test). Moreover, the ratio between coupled respiration and leak was strongly altered (J). (K,L) Prevalence of the grade 3 phenotype can be modified by altering the endogenous levels of GSH. Larvae were pre-incubated with either 50 µM N-acetyl-L-cysteine (NAC) or 0.5 µM diethylmaleate (DEM) for 24 h (from 6 to 7 dpf) followed by co-exposure with 3 µM CPO for 24 h (from 7 to 8 dpf). (K) Increasing the GSH levels with N-acetyl-L-cysteine (NAC) decreased the prevalence of the grade 3 phenotype by 67% [3 groups with 8–19 larvae each were analysed for 3 µM CPO and 3 groups with 13–23 larvae for 3 µM CPO + 50 µM NAC; p < 0.05, Student’s t-test]. (L) Decreasing the GSH levels with diethylmaleate (DEM) increased the prevalence of grade 3 larvae by 82% [6 groups with 22–46 larvae each were analysed for 3 µM CPO and 6 groups with 21–43 larvae for 3 µM CPO + 0.5 µM DEM; p < 0.05, Student’s t-test]. (M,N) Prevalence of the grade 3 phenotype in zebrafish larvae exposed to 3 µM CPO is not significantly reduced by either antioxidant. Larvae were pre-treated with the antioxidants vitamin C and MitoQ for 3 h or 24 h, respectively, followed by co-exposure with 3 µM CPO for an additional 24 h (M); 4 groups with 13–22 larvae each per condition; p > 0.05, one-way ANOVA with Dunnett’s multiple comparison test) or MitoQ (N); 4–8 pools with 19–24 larvae each per condition; p > 0.05, Student’s t-test). Abbreviations: n.s., not significant. |
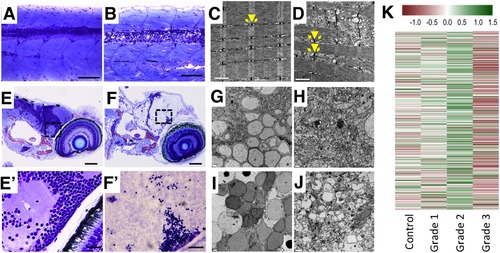
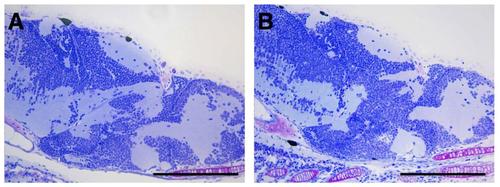
Histopathological assessment of grade 3 larvae shows severe lesions in the central nervous system and muscle fibres. (A,B) Myotomes with fast-twitch fibres and the spinal cord of representative control (A) and grade 3 (B) larvae in a medial plane section of the trunk. In the grade 3 larva, severe alterations in the fast-twitch fibres and spinal cord are evident. The spinal cord displays severe necrotic changes, with disruption of the normal nuclear distribution in the neuronal bodies (grey matter) and severe vacuolization of axons (white matter). (C,D) Electron micrographs of fast-twitch muscle from control (C) and grade 3 (D) larvae. Whereas control muscles (C) exhibit the normal arrangement of sarcomeres, with well-developed t-tubules (arrowhead) and terminal cisternae (arrows), grade 3 muscles (D) exhibit swelling of the longitudinal sarcoplasmic reticulum and the terminal cisternae. Moreover, irregular spacing of adjacent myofibres and serious disruption of some of the myofibres are evident in grade 3 larvae. (E,F) Retina and brain of representative control (E) and grade 3 (F) larvae. Grade 3 larvae exhibit liquefactive necrosis at the brain level. (E′,F′) Higher magnification of the brain at the optic tectum level corresponding to the area indicated by a frame dashed box at (E) and (F). Whereas the control larva exhibits a normal structure in both neuronal bodies and axons (E′), the grade 3 larva exhibits pyknotic nuclei and striking alteration of the axons (loss of integrity, granular aspect, faint colour) (F′). (G-J) Characteristics of neuronal bodies (G, I) and axons (H,J) in TEM sections of the brain of representative control (G-H) and grade 3 (I-J) larvae. Whereas severely altered neuronal bodies (nuclear changes associated with necrotic processes) are evident in (I), altered axons, some of which are extremely enlarged, are present in (J). (K) Heatmap of the neuroactive ligand-receptor interaction pathway shows the strong down-regulation of this pathway found in grade 3 larvae. This result is consistent with the severe disruption of the CNS found at the histological level in this phenotype. Scale bars: (A,B) 100 µm, (C,D) 1 µm, (E,F) 100 µm, (G,H) 2 µm, (E′,F′) 20 µm, (I,J) 2 µm. |

Morphological features on 8 days post-fertilization zebrafish larvae exhibiting moderate and severe acute organophosphorus poisoning by 24 h exposure to chlorpyrifos-oxon. (A) Lateral views of three representative larvae exhibiting grade 2 (moderate) phenotype, with stiffness, impaired relaxation of the axial muscle fibers and overinflation of the swim bladder. Arrowheads indicate folding of the apical ectodermal ridge. White asterisks indicate the over-inflated swim bladder. Arrow indicates altered jaw in a larvae resulting from the hyperactivity of the jaw muscles. (B-E) Compacted head and periocular and/or peritoneal edema are common features in grade 3 (severe) phenotype. Lateral view (B,C) and dorsal view (D,E) of control (B,D) and grade 3 (C,E) larvae. Dashed trace shows the dramatic change in the morphology of the head in grade 3 larva (C). Presence of periocular (C,E) and peritoneal (C) edema are indicated by arrows. Scale bar: 400 µm. |
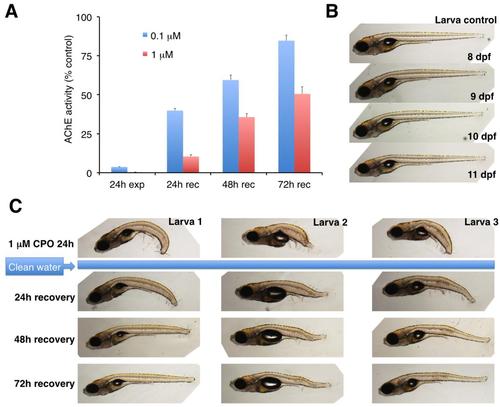
Partial recovery of AChE activity and grade 2 phenotype in zebrafish larvae exposed to 1 µM chlorpyrifos-oxon after the transfer to clean water. (A) Analysis of the recovery of AChE activity shows a clear dependence on the grade of severity/chlorpyrifos-oxon (CPO) concentration. Larvae were exposed to 0.1 and 1 µM CPO for 24h and the resulting grades 1 (0.1 µM) and 2 (1 µM) were analysed (total n=192, with 16 individuals for each experimental group, mean ± s.e.m.). (B) Normal phenotype of a vehicle exposed 8- 11 dpf zebrafish larva. (C) Phenotype of three grade 2 larvae immediately after 24 h exposure to 1 µM CPO, and 24-72 h after the transfer to clean water. A partial rescue of the phenotype is evident 3 days after the transfer to clean water. |
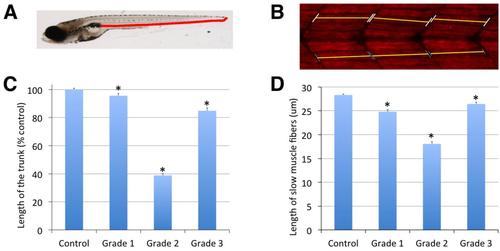
Chlorpyrifos-oxon induces reduction in the length of the trunk and axial slow muscle fibers in zebrafish larvae. (A) Lateral view of a control 8 dpf zebrafish larva. Red segment, between the most caudal part of swim bladder and the tip of the tail, corresponds with the “length of the trunk”, the part of the larva containing most of the axial muscle fibers. (B) The length of six slow muscle fibers, at the level of the lower intestine, up and down of the horizontal myoseptum, was measured in larvae control, as well as in larvae exposed for 24 h to 0.1 µM (grade 1), 0.75 µM (grade 2) and 6 µM (grade 3) chlorpyrifos-oxon (5 larvae per experimental group). In order to identify easily slow muscle fibers, whole-mount immunofluorescence analysis was performed by using a primary antibody against myosin heavy chain (F59, from DSHB). Length of the trunk and axial muscle fibers was determined by using the free image analysis software ImageJ (U. S. National Institutes of Health, Bethesda, Maryland, USA, http://imagej.nih.gov/ij/). (C) Length of the trunk was significantly reduced in the all three grades of severity, but specially in grade 2 (n=14-23; p<0.005 for grade 1 and P <0.001 for grade 2 and 3, mean ± s.e.m., one-way ANOVA with Dunnett’s multiple comparison test). (D) Length of the slow muscle fibers was significantly reduced in all the grades, but specially in grade 2 larvae (mean ± s.e.m., p<0.001, one-way ANOVA with Dunnett’s multiple comparison test). |
Histopathological analysis of grade 1 phenotype. Semithin sections, at the trunk (A,B) and brain (C,D) level, of representative 8 days post-fertilization control (A,C) and grade 1 (B,D) larvae. No differences in the axial fast-twitch muscle fibers or brain are evident at histological level. Scale bar: 200 µm. |
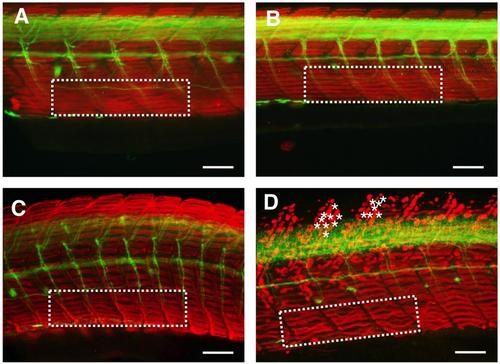
Characterization of pathological features at the trunk level in the different grades of severity of acute organophosphorus poisoning induced by chlorpyrifos-oxon in zebrafish larvae. Lateral view of the trunk of 8 dpf zebrafish larvae control (A), grade 1 (B), grade 2 (C) and grade 3 (D) after the double whole-mount immunofluorescence with F59 (red staining) and anti-acetylated alpha tubulin (green staining) antibodies. This labelling provides information on integrity and architecture of slow muscle fibers and spinal axonal tracts, respectively. The area within the white dashed lines shows the arrangement of the slow muscle fibers in a similar region of the ventral trunk in the different phenotypes. Asterisks indicate rupture or detachments of slow muscle fibers along the dorsal trunk of a representative grade 3 larva. Lateral view of the trunk (dorsal is to the top and anterior is to the left). Scale bar: 100 µm. |
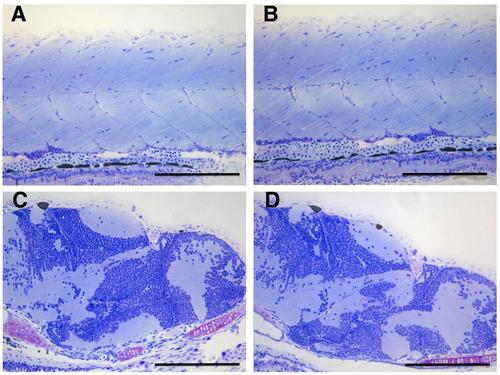
Histophathological evaluation of the central nervous system in grade 2 phenotype. Semithin section of the brain of representative control (A) and grade 2 (B) 8 days post-fertilization larvae. No differences in the histology of the brain were evident in grade 2 larvae respect to the control. Scale bar: 200 µm. |
Liver structure is not altered in acute organophosphorus poisoning in zebrafish. Normal hepatic structures and normal hepatocytes are observed both in 8 days post-fertilization control (A), grade 1 (B), grade 2 (C) and grade 3 (D) zebrafish larvae. Hepatocyte nuclear size may not be homogeneous in the same fish and darker nuclei in D correspond to erythroblasts/erythrocytes. The presence of lipid droplets (white spherical structures) is a normal observation corresponding to yolk remnants, and their number may not always be homogeneous in fish from the same batch. Scale bar: 80 µm. |
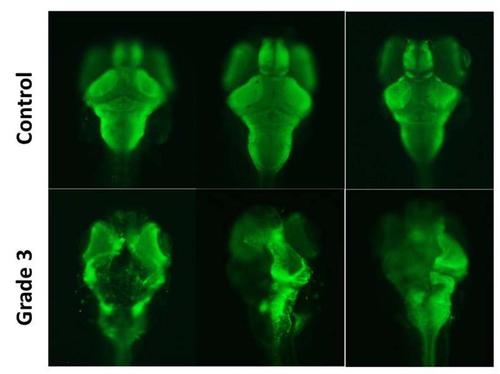
Grade 3 larvae exhibit severe impairment in the brain architecture. Dorsal view of 3 heads of 8 days post-fertilization control and grade 3 zebrafish larvae, after the staining of the axonal tracts with an acetylated alpha-tubulin (green) monoclonal antibody by whole-mount immunofluorescence. The severe damage in the axonal tracts found in the brain of grade 3 larvae is consistent with the results of the semithin sections and transmission electron microscopy (TEM). |
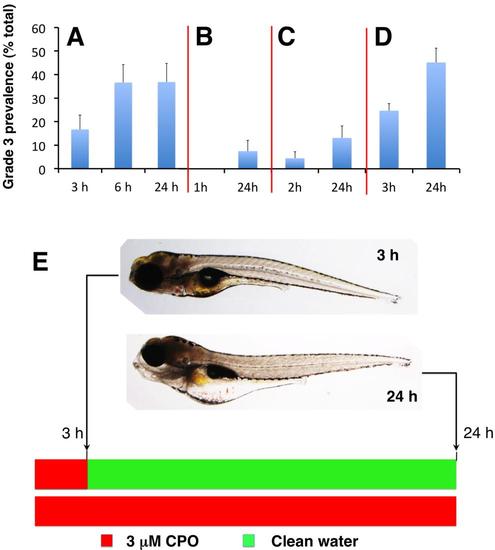
Commitment to grade 3 phenotype occurs during the first 3 h post-exposure. (A) 7 dpf zebrafish larvae were exposed to 3 µM chlorpyrifos-oxon (CPO) and the prevalence of grade 3 phenotype was evaluated after 3, 6 and 24 h exposure. No differences en the grade 3 prevalence were found between larvae exposed to CPO for 6 and 24 h [n= 6 experimental groups with 8 larvae each; p=0.492, Student’s t-test (t(10) = 0.0199)]. (B-D) 7 dpf zebrafish larvae were exposed to 3 µM CPO for 1 h (B), 2 h (C) and 3 h (D) and then transferred to clean water for additional 23, 22 and 21 h. For each experimental group, prevalence of grade 3 phenotype was analysed at the end of the CPO exposure period and after the period in clean water. At 8 dpf, no differences in grade 3 prevalence were found between the larvae continuously exposed to 3 µM CPO for 24 h and those exposed for only 3 h and then transferred to clean water for additional 21 h [n= 6 experimental groups with 8 larvae each; p=0.212, Student’s t-test (t(10) = 0.836)]. (E) Lateral view of a single representative zebrafish grade 3 larva exposed to 3 uM CPO for 3 h (top) and then transferred to clean water for additional 21 h (bottom). At 3 h are already evident the changes in the morphology of the head typical of grade 3 larvae. No recovery of the phenotype was found after 21 h of depuration in clean water (bottom). By contrast, the phenotype of the larvae after the depuration period was indistinguishable of the larvae exposed continuously during 24 h. Data presented as mean ± s.e.m. |
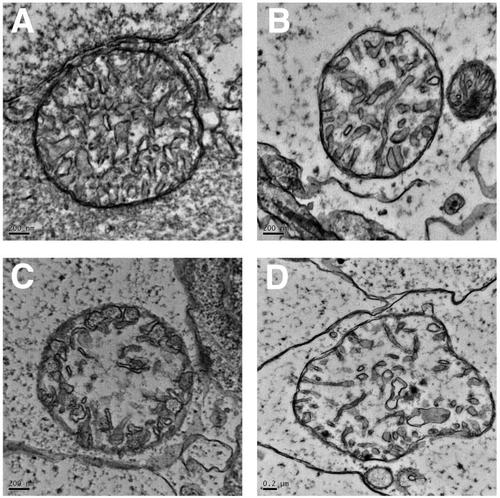
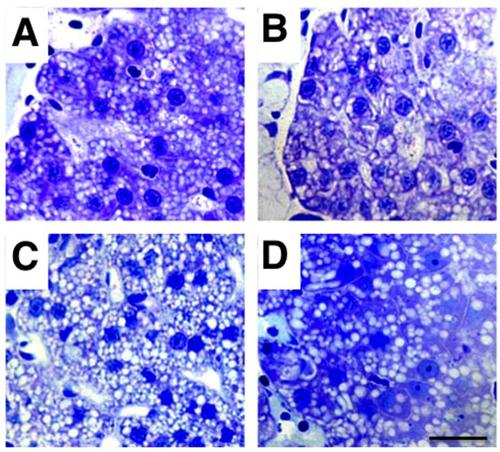
Swelling and loss of cristae in the mitochondria of the grade 3 larvae (brain). Transmission electron microscopy images of one mitochondrion control (A) and three mitochondria from the brain of 8 days postfertilization grade 3 larvae (B-D). |
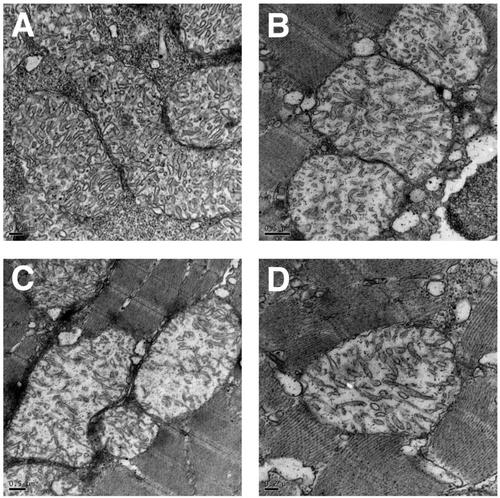
Swelling and loss of cristae in the mitochondria of the grade 3 larvae (fast-twitch axial muscle fibers). Transmission electron microscopy images of one mitochondrion control (A) and three mitochondria from the fast muscle fibers of 8 days post-fertilization grade 3 larvae (B-D). |