
|
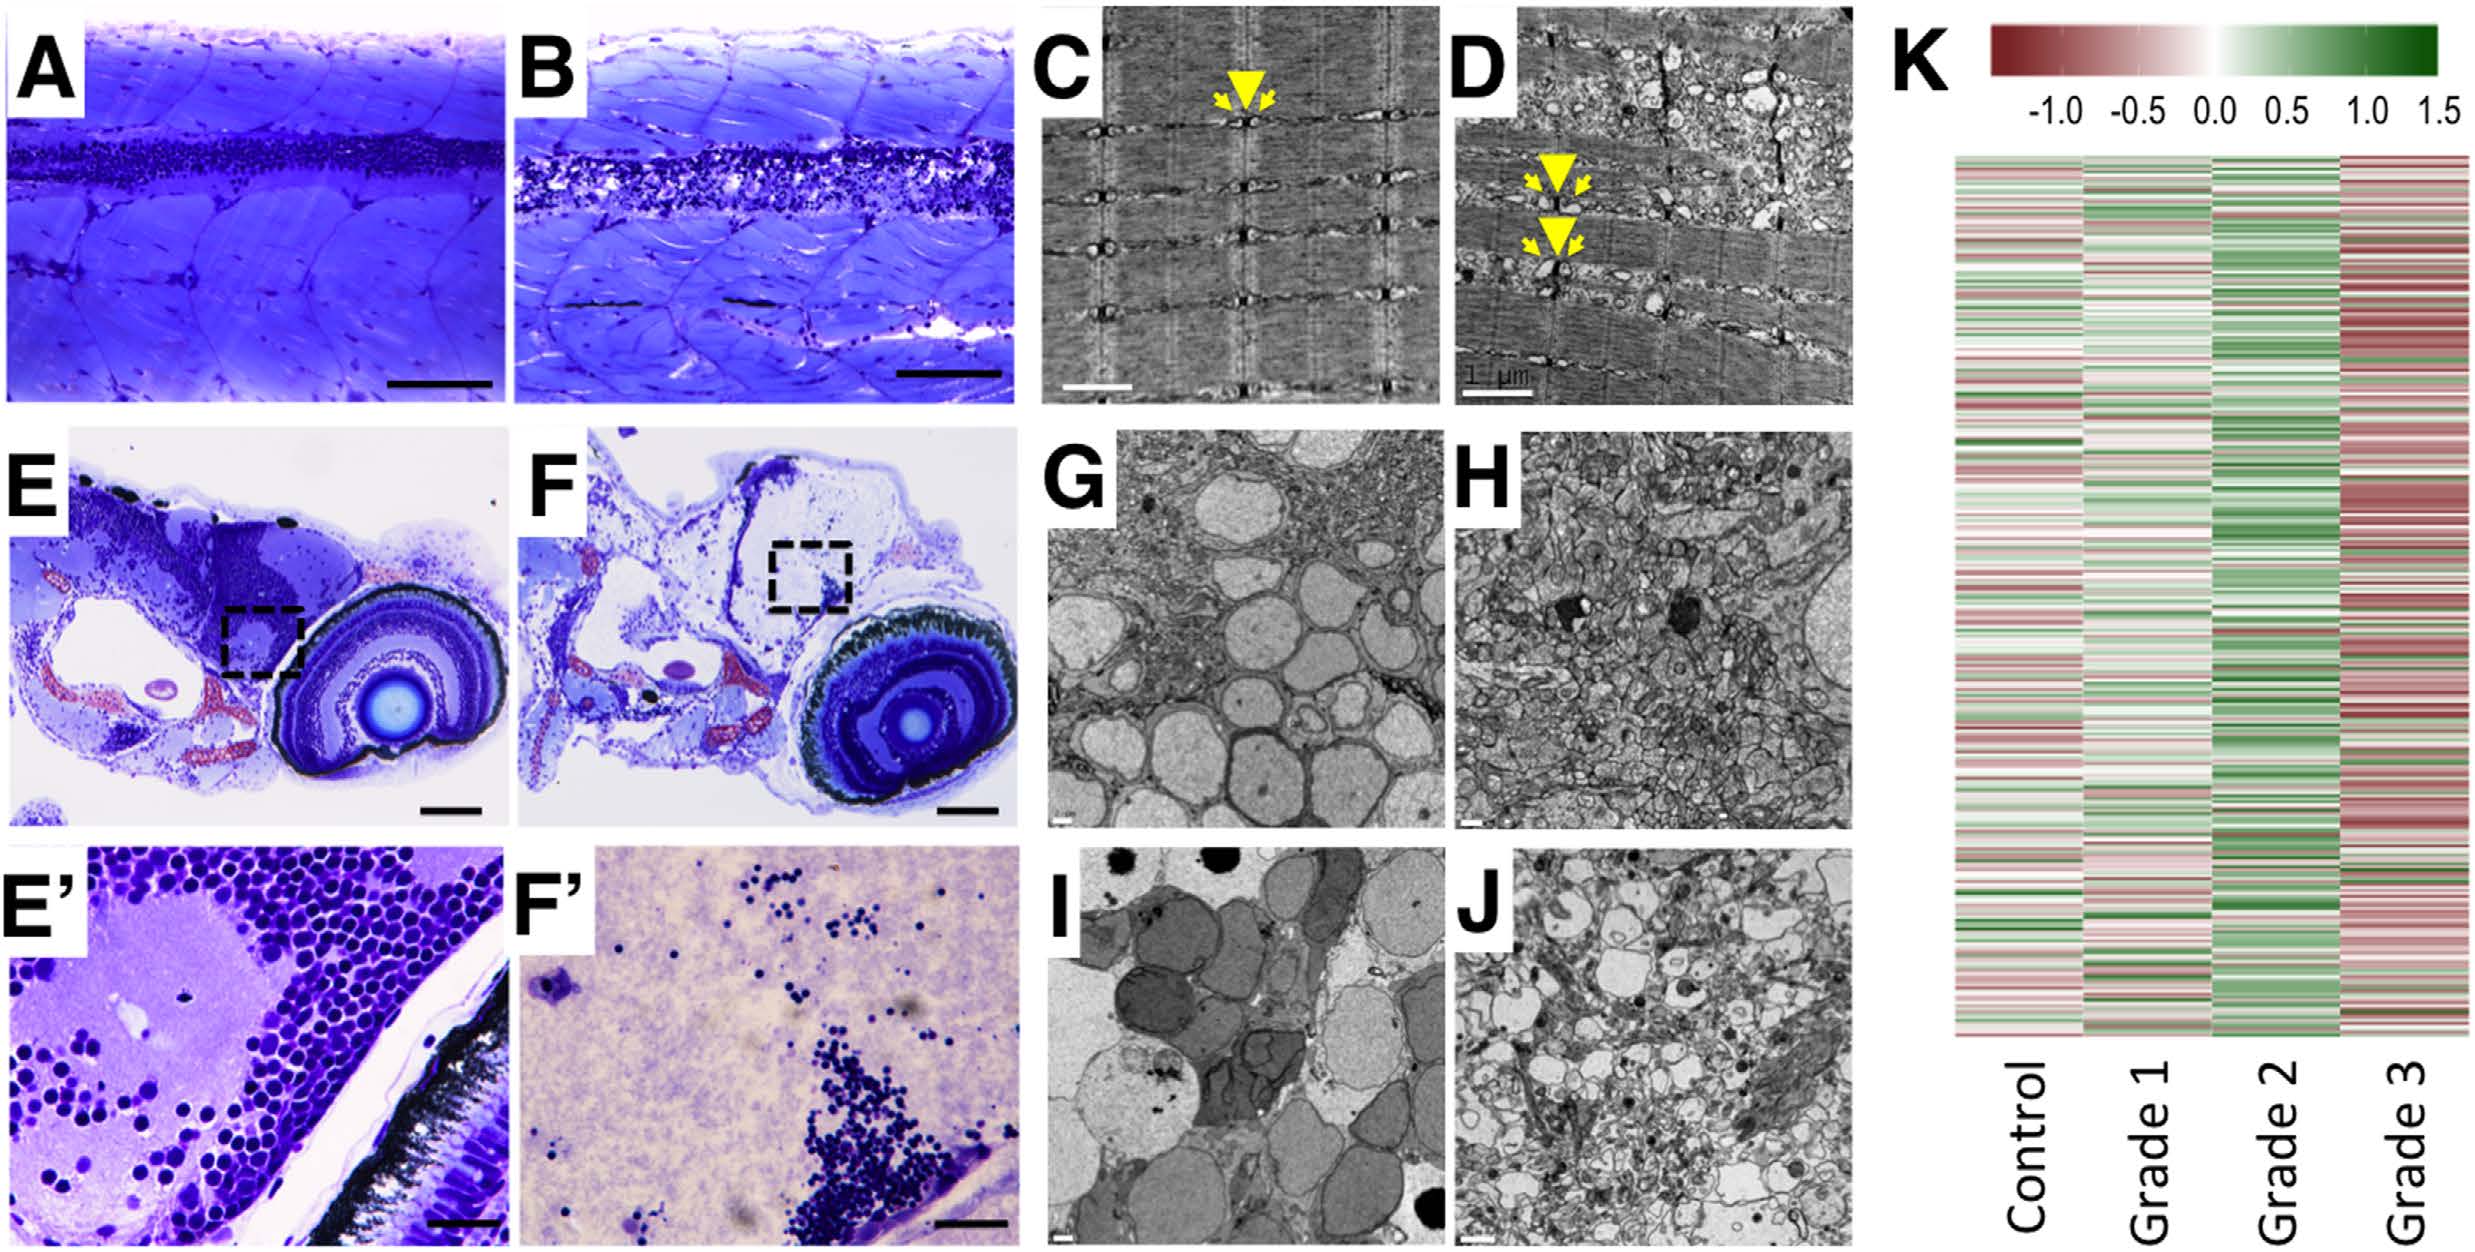
Fig. 6
Histopathological assessment of grade 3 larvae shows severe lesions in the central nervous system and muscle fibres.
(A,B) Myotomes with fast-twitch fibres and the spinal cord of representative control (A) and grade 3 (B) larvae in a medial plane section of the trunk. In the grade 3 larva, severe alterations in the fast-twitch fibres and spinal cord are evident. The spinal cord displays severe necrotic changes, with disruption of the normal nuclear distribution in the neuronal bodies (grey matter) and severe vacuolization of axons (white matter). (C,D) Electron micrographs of fast-twitch muscle from control (C) and grade 3 (D) larvae. Whereas control muscles (C) exhibit the normal arrangement of sarcomeres, with well-developed t-tubules (arrowhead) and terminal cisternae (arrows), grade 3 muscles (D) exhibit swelling of the longitudinal sarcoplasmic reticulum and the terminal cisternae. Moreover, irregular spacing of adjacent myofibres and serious disruption of some of the myofibres are evident in grade 3 larvae. (E,F) Retina and brain of representative control (E) and grade 3 (F) larvae. Grade 3 larvae exhibit liquefactive necrosis at the brain level. (E′,F′) Higher magnification of the brain at the optic tectum level corresponding to the area indicated by a frame dashed box at (E) and (F). Whereas the control larva exhibits a normal structure in both neuronal bodies and axons (E′), the grade 3 larva exhibits pyknotic nuclei and striking alteration of the axons (loss of integrity, granular aspect, faint colour) (F′). (G-J) Characteristics of neuronal bodies (G, I) and axons (H,J) in TEM sections of the brain of representative control (G-H) and grade 3 (I-J) larvae. Whereas severely altered neuronal bodies (nuclear changes associated with necrotic processes) are evident in (I), altered axons, some of which are extremely enlarged, are present in (J). (K) Heatmap of the neuroactive ligand-receptor interaction pathway shows the strong down-regulation of this pathway found in grade 3 larvae. This result is consistent with the severe disruption of the CNS found at the histological level in this phenotype. Scale bars: (A,B) 100 µm, (C,D) 1 µm, (E,F) 100 µm, (G,H) 2 µm, (E′,F′) 20 µm, (I,J) 2 µm.